


- Glassnode announced in a tweet this morning that Ethereum’s Mean Block Size has reached a new 1-month high.
- At press time, the leading altcoin was worth about $1,847.37 after a 0.96% price increase.
- Over the past 2 days, ETH’s price had flipped the resistance levels at $1,816.5 and $1,842.6 into support.
The on-chain analysis platform, Glassnode, recently shared on Twitter that the mean block size of Ethereum (ETH) has reached a new 1-month high, measuring 121,439.928. This surpassed the previous high of 121,327.386, which was observed on 27 May 2023.
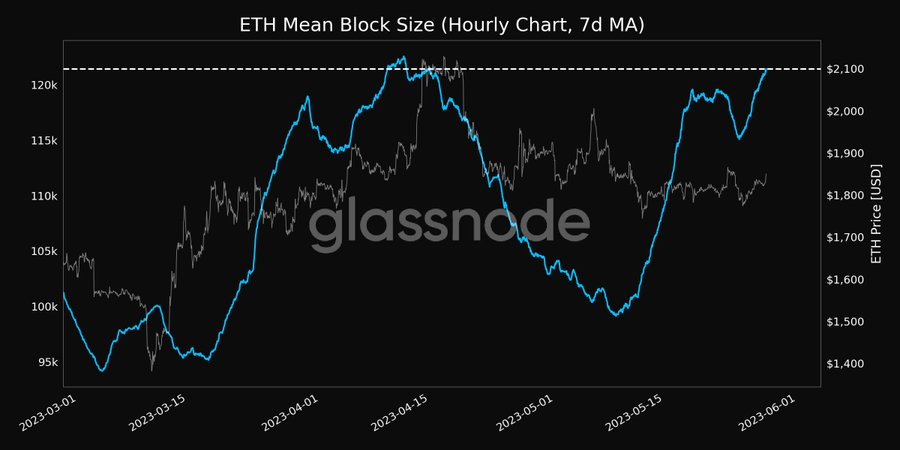
The block size refers to the amount of data or transactions included in a single block of the blockchain. This increase indicates a larger average data volume in recent blocks, potentially improving network capacity and transaction throughput.
Meanwhile, at press time, CoinMarketCap indicated that ETH was trading hands at $1,847.37 after a 0.96% price increase over the past 24 hours. As a result, ETH was trading closer to its daily high of $1,859.79 than its 24-hour low of $1,817.49.
However, the leading altcoin’s positive performance was not enough for it to strengthen against its biggest competitor Bitcoin (BTC). At press time, ETH was 0.93% down against BTC. On the other hand, ETH’s recent increase did push its weekly performance further into the green to +1.73%.
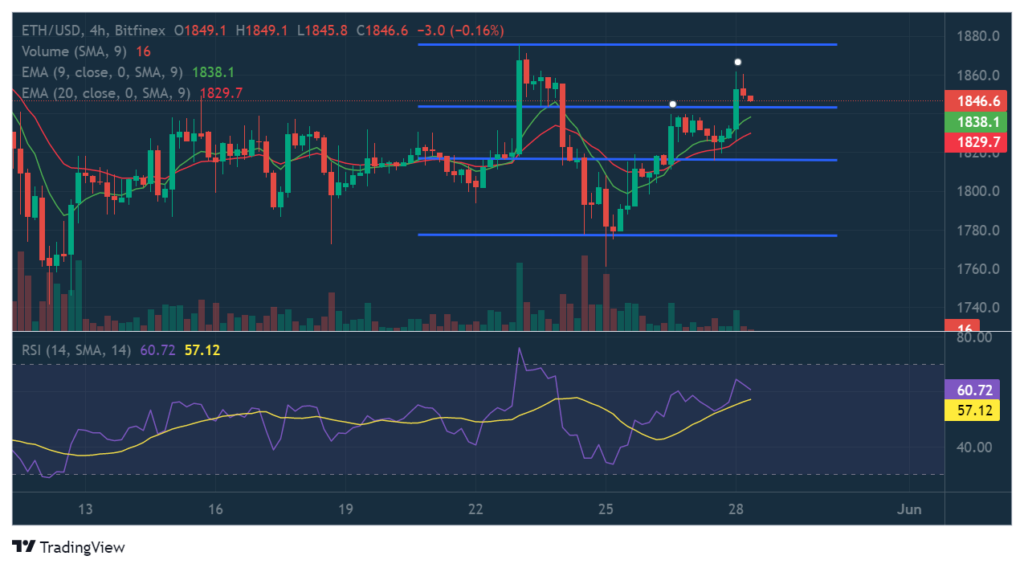
ETH’s price had flipped the resistance levels at $1,816.5 and $1,842.6 into support over the past 48 hours. At press time, the altcoin leader’s price continued to trade above the key $1,842.6 mark.
The RSI indicator on the 4-hour chart suggested, however, that ETH’s price would drop below the key level in the next 24 hours, as the RSI line was sloped negatively towards oversold territory. In addition to this, the RSI line was on the verge of crossing below the RSI SMA line.
Disclaimer: The views and opinions, as well as all the information shared in this price analysis, are published in good faith. Readers must do their own research and due diligence. Any action taken by the reader is strictly at their own risk. Coin Edition and its affiliates will not be held liable for any direct or indirect damage or loss.
Disclaimer: The information presented in this article is for informational and educational purposes only. The article does not constitute financial advice or advice of any kind. Coin Edition is not responsible for any losses incurred as a result of the utilization of content, products, or services mentioned. Readers are advised to exercise caution before taking any action related to the company.


