


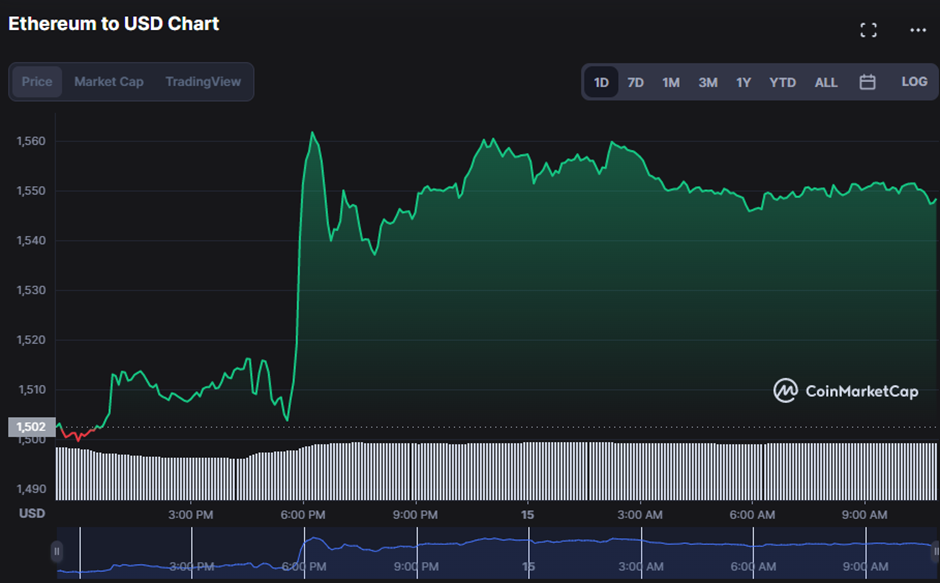
- Ethereum (ETH) bulls regain market dominance after finding $1,499.35 support.
- Indications point to a tightening bullish grip in the foreseeable future.
- Bulls need to break through $1,562.03 resistance to keep the rally going.
As the trading day began, the Ethereum (ETH) market was under pressure from sellers. However, the day’s low of $1,499.35 supported halting this trend. Nonetheless, buyers pushed the price to a new intraday high of $1,562.03. As of writing, bullish dominance had taken hold, driving the price of ETH to soar 3.07% to $1,546.76.
Market cap increased 3.04% to $189,315,284,286, and 24-hour trading volume increased 8.72% to $9,215,885,858 during the upturn. This increase in market value and the trading volume reflects the widespread optimism around ETH and the robustness of its fundamentals.
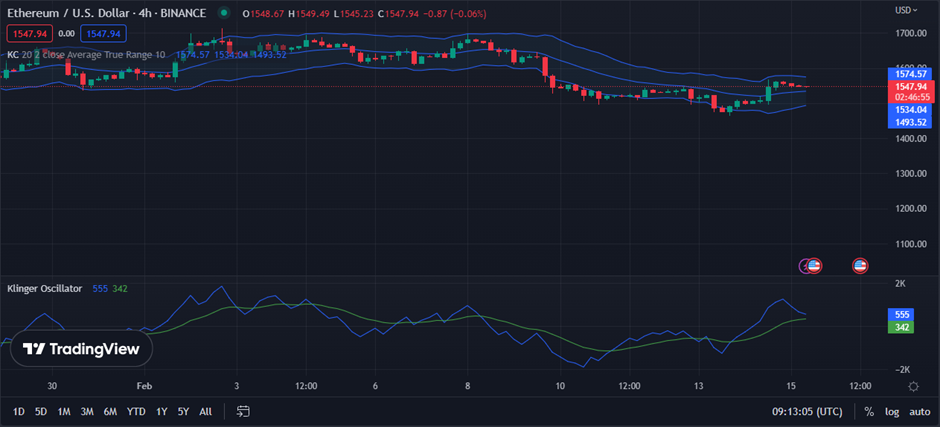
The Keltner Channel’s upward and linear movement, with the upper band at $1574.54 and the lower band at $1534.02, suggests that the bullishness in ETH is likely to persist in the short-term, with a high possibility of a bullish breakout. If ETH breaks over $1574.54, the prospect for more bullish gains is significant, as it is already approaching the upper band.
To preserve this potential, ETH must hold the support of around $1534.02. If it does, traders may expect a retest of the $1574.54 level, followed by a bullish breakout with additional gains likely aiming for $1600 as the next significant barrier.
The Klinger Oscillator fluctuates above its signal line with a reading of 561, indicating that the bullish trend is likely to continue in the short term. With the Klinger Oscillator indicating intense buying pressure, ETH bulls could look to breach the $1574.54 level because the momentum for such a bullish breakout appears to be strong.
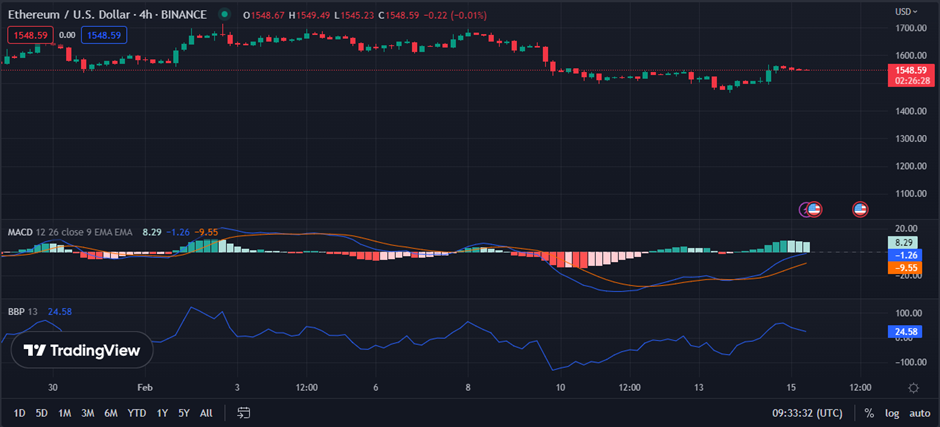
Since the MACD line crosses above the signal line with a value of -1.34 and travels north, aiming to break over the “0” line, the bullish trend in ETH looks to be intensifying.
Furthermore, as the MACD line climbs farther above the signal line, ETH demonstrates increasing confidence in the general bullish trend and seems to be on track for a prolonged period of growth.
This shift is a clear sign that the bull trend in ETH will continue, and investors should attempt to profit from this market action.
With a Bull Bear Power (BBP) of 24.49, the bullish trend in ETH is further reinforced and looks to be approaching an even greater level. Moreover, as the BBP rises, so does the strength of the bullish trend, giving it an even greater chance for investors to profit from the upward momentum.
Furthermore, as the MACD line rises, the signal line converges more, and the BBP increases, giving investors a clear indicator that the positive ETH trend will likely continue for an extended time.
If bullish strength dominates in the foreseeable future, technical indicators predict a lengthy bull run in the ETH market.
Disclaimer: The views and opinions, as well as all the information shared in this price analysis, are published in good faith. Readers must do their own research and due diligence. Any action taken by the reader is strictly at their own risk, Coin Edition and its affiliates will not be held liable for any direct or indirect damage or loss.
Disclaimer: The information presented in this article is for informational and educational purposes only. The article does not constitute financial advice or advice of any kind. Coin Edition is not responsible for any losses incurred as a result of the utilization of content, products, or services mentioned. Readers are advised to exercise caution before taking any action related to the company.


