





- EVAA surges 252% weekly as breakout and record volume fuel strong bullish momentum.
- Record $118M open interest points to higher volatility as leveraged trading expands.
- Holding above $2.66 support could open the path for another rally toward $4.00.
EVAA Protocol’s explosive rally has pushed the token into the spotlight after posting triple-digit gains within a week. The sharp advance came alongside exceptional trading activity, rising derivatives participation, and a decisive technical breakout that shifted market sentiment firmly in favor of buyers.
Although the token experienced mild profit-taking after reaching a new local high, its broader market structure continues to favor the upside. At the same time, elevated trading volumes and record open interest suggest traders should expect larger price swings as speculative activity remains unusually high.
EVAA Breaks Out as Trading Activity Surges
EVAA traded at $2.90 at the time of writing, marking a 172.19% gain over the past 24 hours and a 252.60% increase during the previous seven days. The token recorded a market capitalization of $19.47 million, supported by a circulating supply of 6.6 million EVAA.
Moreover, trading activity accelerated at an even faster pace than price. Spot trading volume climbed more than 1,146%, reaching $76.3 million within 24 hours. The turnover ratio of 1.42 indicated that a significant portion of the circulating supply changed hands during the session.
Such elevated turnover often reflects strong retail participation rather than long-term accumulation. Consequently, EVAA moved independently from the broader cryptocurrency market, even as Bitcoin posted a slight decline during the same period.
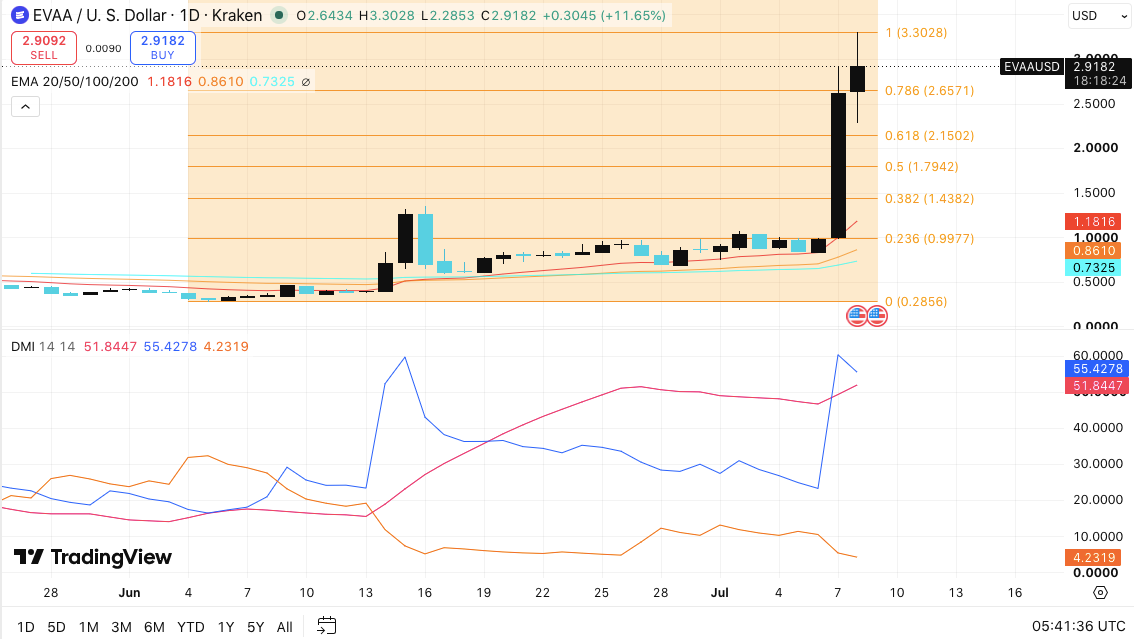
Daily price action also confirmed a major technical shift. Buyers pushed EVAA from around $1.00 to an intraday peak near $3.30 before the token settled close to $2.92. Besides, the rally carried the price above the 20-day, 50-day, 100-day, and 200-day exponential moving averages, reinforcing bullish momentum across multiple timeframes.
Technical Structure Favors Further Upside
The recent advance reclaimed the 0.786 Fibonacci level near $2.66, converting former resistance into immediate support. Hence, maintaining prices above the $2.65–$2.70 region would strengthen the current bullish structure.
The next major hurdle remains the recent high around $3.30. A convincing breakout above that level could encourage another upward leg toward the $3.50–$4.00 range.
However, traders should also monitor downside levels. Stronger support appears near $2.15, followed by $1.79. Even a retreat toward $1.44 would leave the broader uptrend intact.
Momentum indicators continue supporting buyers. The positive directional index remains above the negative directional index, while the Average Directional Index remains relatively low. This combination suggests the emerging trend still has room to strengthen if buying pressure continues.
Record Open Interest Signals Higher Volatility
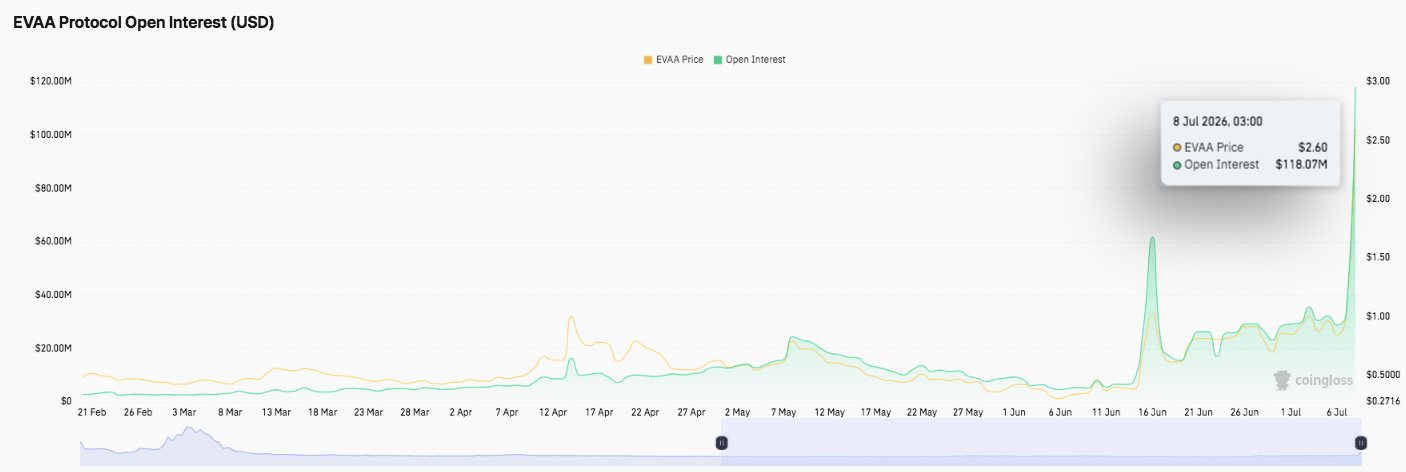
Derivatives data also reflects growing market confidence. Open interest remained relatively quiet through early spring before steadily increasing alongside improving sentiment.
Additionally, speculative participation accelerated sharply during June and early July. Open interest recently climbed to a record $118.07 million, highlighting a substantial increase in leveraged positions. While this development confirms stronger trader participation, it also raises the likelihood of sharper price fluctuations during future sessions.
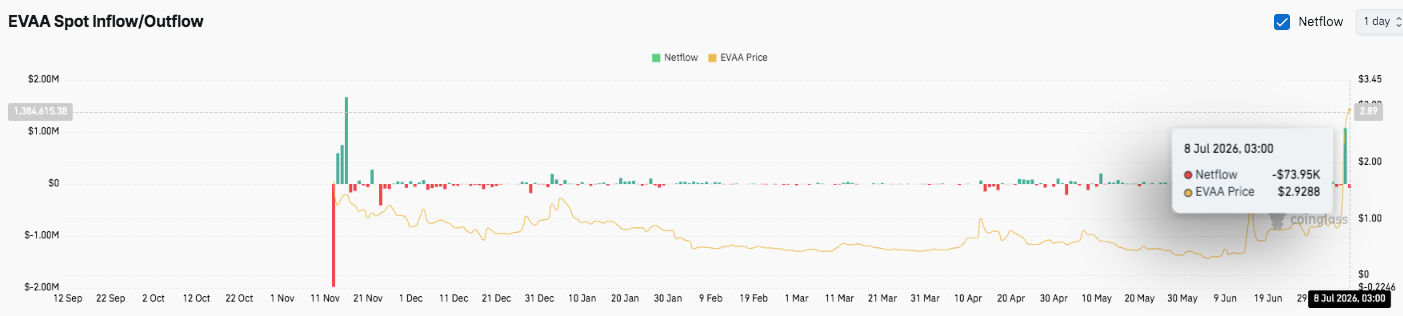
Meanwhile, spot flow data presents a more balanced picture. Earlier periods showed aggressive inflows followed by sizable outflows as traders locked in profits. More recently, capital movement has stabilized, with the latest session recording only a modest net outflow of roughly $73,950.
Overall, EVAA continues to display strong bullish momentum. Nevertheless, sustained buying above key support levels will likely determine whether the token extends its rally or enters a period of healthy consolidation.
Technical Outlook for EVAA Protocol Price
Key levels remain in focus following EVAA’s explosive breakout, as traders assess whether the rally can extend or enter a healthy consolidation phase.
Upside levels: $3.30 remains the immediate breakout resistance. A decisive move above this level could pave the way toward the psychological $3.50 and $4.00 targets, where fresh selling pressure may emerge.
Downside levels: Initial support sits between $2.65 and $2.70, aligning with the 0.786 Fibonacci retracement. Below that, stronger buying interest could appear around $2.15, followed by $1.79. A deeper correction toward $1.44 would still preserve the broader bullish market structure.
Momentum signals: EVAA continues to trade above its 20-day, 50-day, 100-day, and 200-day EMAs, reinforcing the strength of the prevailing uptrend. Meanwhile, rising open interest above $118 million reflects growing speculative participation, although it also increases the risk of sharp price swings if leveraged positions unwind.
Will EVAA Protocol Go Up?
EVAA’s price outlook remains constructive as long as buyers defend the $2.65–$2.70 support zone. Holding above this level would keep bullish momentum intact and increase the probability of another attempt at the $3.30 resistance. A confirmed breakout above that barrier could accelerate gains toward $3.50 and $4.00.
However, the token’s rapid rally and exceptionally high trading turnover suggest short-term profit-taking remains a possibility. If sellers regain control and price falls below $2.65, EVAA could retrace toward $2.15 or even $1.79 before attracting fresh demand.
For now, EVAA remains one of the strongest momentum plays in the market, but the next directional move will likely depend on whether buyers can sustain volume and defend key Fibonacci support levels.
Disclaimer: The information presented in this article is for informational and educational purposes only. The article does not constitute financial advice or advice of any kind. Coin Edition is not responsible for any losses incurred as a result of the utilization of content, products, or services mentioned. Readers are advised to exercise caution before taking any action related to the company.




