


 Market Anticipates To Recover Positive Outlook")
- Bullish momentum shortlived as bearish the trend recoups the Fantom market.
- Technical indicators indicate that investors should be watchful of a possible reversal.
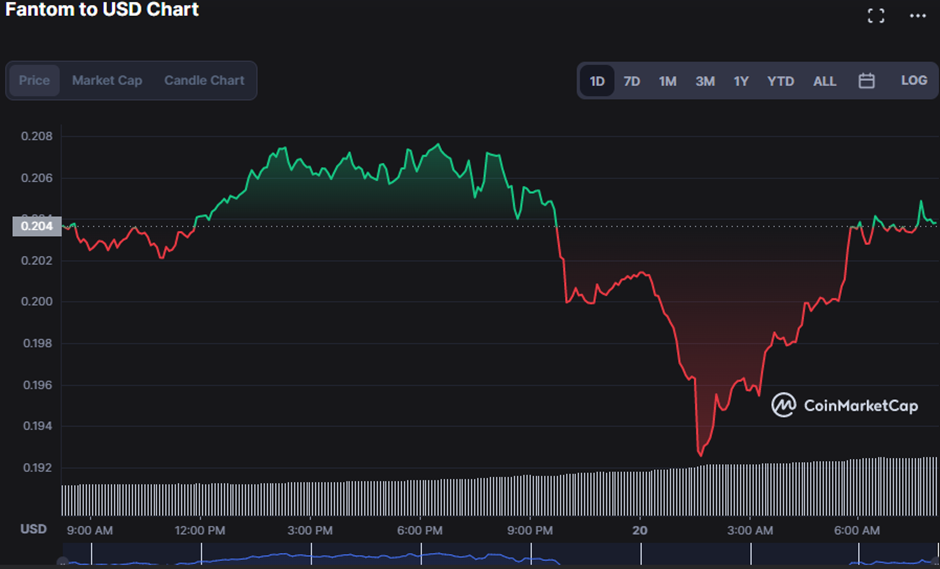
- Bulls successfully hiked the FTM price to $0.2076 before facing stiff resistance.
Following a drop and sell in the Fantom (FTM) market, bulls pounced, invalidating the bearish forecast; however, their reign was short-lived as bears recaptured the market, dragging prices to $0.2033, a 0.28% dip.
This bleak trend is mirrored in a 0.31% drop in market capitalization and a 96.60% increase in 24-hour trading volume, both of which have reached $562,394,404 and $64,665,195, respectively. This increased volume amid a decline may indicate that it is advisable to remain on the sidelines.
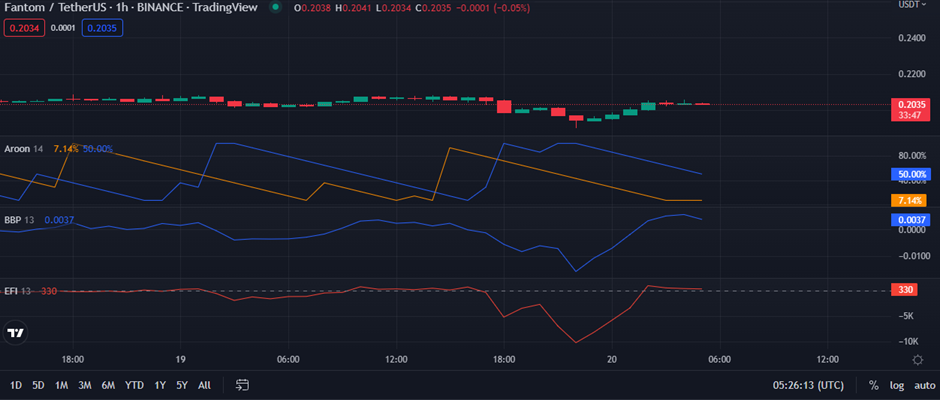
As the bullish trend continues, the 1-hour price chart shows the aroon up crossing above the aroon down at 50.00% and 7.14%, respectively. This increase in bullish strength is encouraging for traders since it indicates additional price gains are likely.
If the Bull Bear Power (BBP) and Elder Force Index (EFI) are both above the zero line, the outlook remains optimistic. The FTM market is showing signs of this bullish pattern, with the BBP and EFI levels now at 0.0036 and 330, respectively, indicating that prices may rise further.
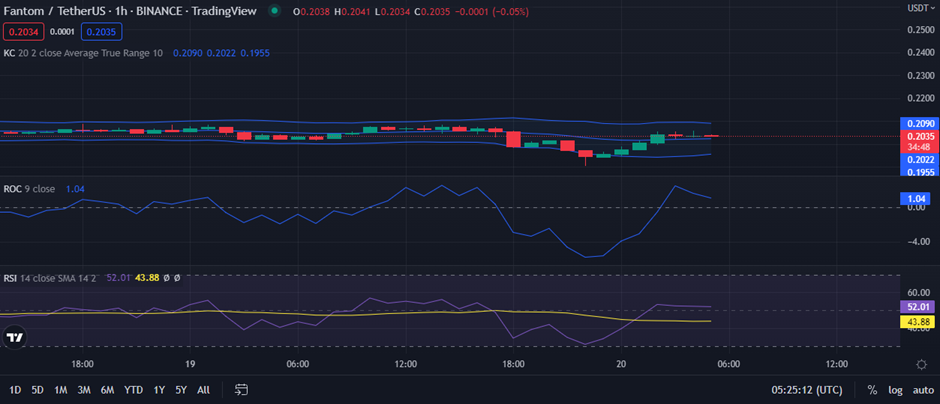
Keltner Channel bands are moving linearly, with the top band hitting 0.2090 and the lower bands touching 0.1955, indicating that the market is healthy. If bulls can maintain their hold above the current resistance level, this pattern indicates that the current trend may continue in the near future.
The rate of change (ROC) trend in the positive region suggests the bulls have the upper hand on the FTM market. However, it is going south with a reading of 1.03 and worries traders that this positive move may be shortlived if bulls don’t press on.
The RSI is at 52.24, indicating a steady market in FTM. This RSI fluctuation indicates that buying and selling pressures are equalizing, but the market is predicted to stay unsettled at this level, alarming traders.
As long as FTM bulls outpace bears, the positive trend may resume in the near term, as long as bulls maintain the resistance level at $0.2076.
Disclaimer: The views and opinions, as well as all the information shared in this price analysis, are published in good faith. Readers must do their own research and due diligence. Any action taken by the reader is strictly at their own risk, Coin Edition and its affiliates will not be held liable for any direct or indirect damage or loss.
Disclaimer: The information presented in this article is for informational and educational purposes only. The article does not constitute financial advice or advice of any kind. Coin Edition is not responsible for any losses incurred as a result of the utilization of content, products, or services mentioned. Readers are advised to exercise caution before taking any action related to the company.
 Price Prediction 2026, 2027, 2028, 2029, 2030 -2050")


