


- Rand Group shows Bitcoin declines repeatedly follow shifts in Federal Reserve leadership cycles.
- Bitcoin trades near $78K as ETF flows reverse and investor sentiment shifts toward caution in volatile conditions.
- Rising inflation and oil above $115 increase macro pressure ahead of the next Federal Reserve transition.
Crypto analyst Rand Group pointed to a recurring pattern between Bitcoin cycles and Federal Reserve leadership changes. In a post on X, he wrote, “But this time will be different right? RIGHT?” His chart shows that major shifts at the central bank have often coincided with sharp Bitcoin corrections.
The data shows Bitcoin dropped about 86% after a leadership change around 2015. It fell another 73% during Janet Yellen’s tenure. Later, the market declined roughly 60% after Jerome Powell took over. Each decline followed a strong rally, suggesting a repeated cycle tied to policy transitions.
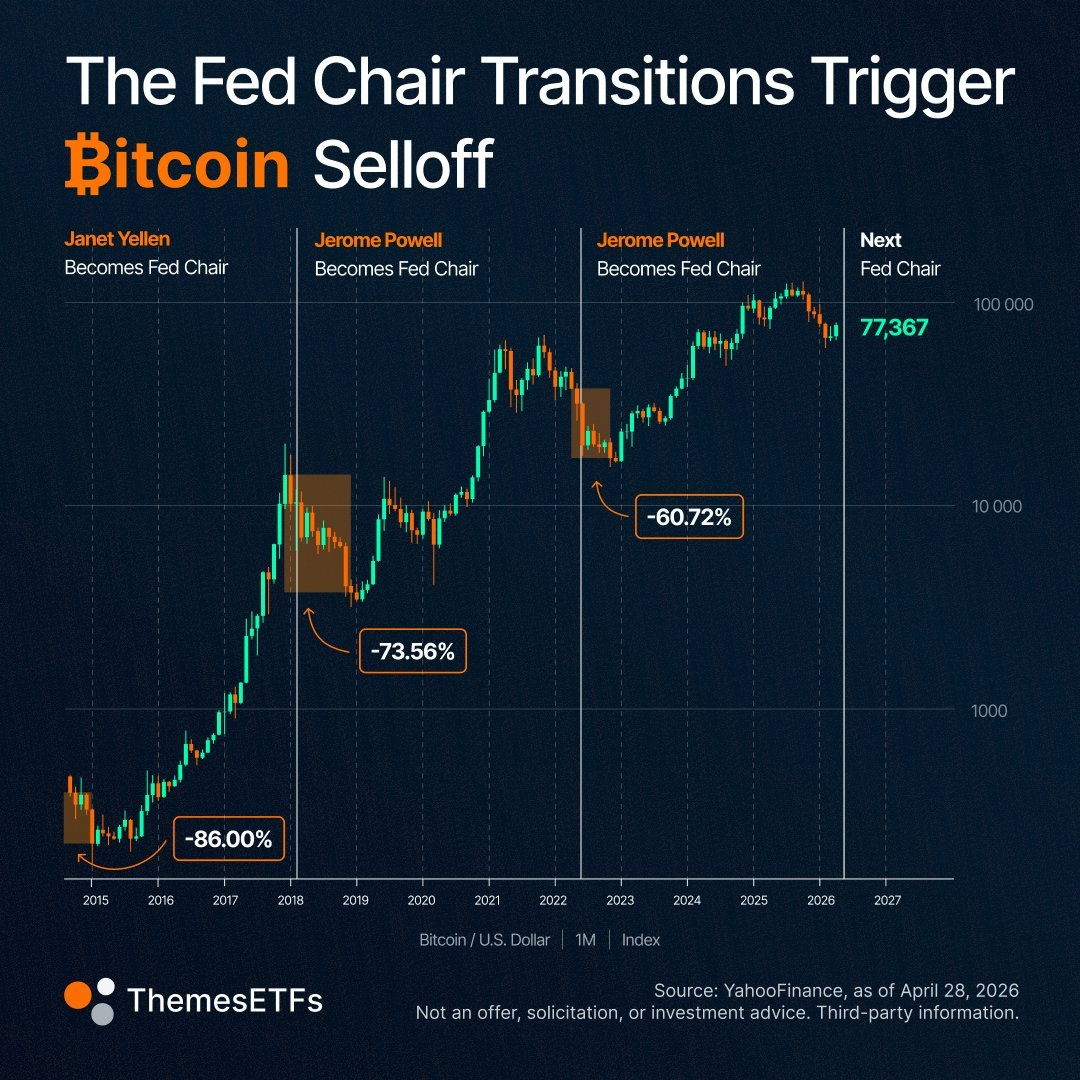
Source: X
Pattern Meets Policy Uncertainty
As of writing, according to CoinMarketcap, the price of Bitcoin is trading at around $78,000 and is relatively stable compared to its performance in previous cycles. But there may be another potential turning point in the market, especially with the Fed changing hands soon.
The incoming Fed chair has signaled support for central bank independence and a smaller balance sheet. Still, investors have little clarity on how policy will evolve. That lack of direction comes at a sensitive time for the economy.
Inflation has risen to 3.3%, its highest level in two years, driven largely by energy costs. Oil prices climbed above $115 as supply risks intensified. Disruptions in the Strait of Hormuz continue to strain global flows, adding pressure just as the Fed prepares for a leadership transition.
Related: Crypto ETF Race Heats Up as Japan’s JPX Targets 2027–2028 Listing Window
Bitcoin Faces Macro Pressure
Bitcoin’s price is a reflection of increasing macro pressures. The recent surge could not exceed $80,000 as rejection continues for the past few weeks. The momentum has been weakening, and buyers have become more careful.
There is also a change in the institutional flow dynamics. The spot ETF inflows had broken records until late April when they reversed to outflows. Selling activity was witnessed in both Bitcoin and Ethereum ETFs.
Broader market behavior is also changing. Retail traders are leaning toward short-term trades rather than long-term crypto positions. Meanwhile, investors are watching Big Tech spending more closely, as shifts in equity sentiment often spill into digital assets.
Rand’s chart points to a familiar risk. If past cycles hold, Federal Reserve leadership changes could coincide with another correction. This time, however, the outcome may hinge on how clearly policymakers signal their next steps.
Related: Bitcoin Bull Run Incoming: S&P 500 and Nasdaq Add $7T in April 2026
Disclaimer: The information presented in this article is for informational and educational purposes only. The article does not constitute financial advice or advice of any kind. Coin Edition is not responsible for any losses incurred as a result of the utilization of content, products, or services mentioned. Readers are advised to exercise caution before taking any action related to the company.
 Price Prediction 2026, 2027, 2028, 2029, 2030 -2050")


