


- Fetch.ai price analysis shows a firm uptrend.
- FET/USD is facing resistance at the $0.4717 level.
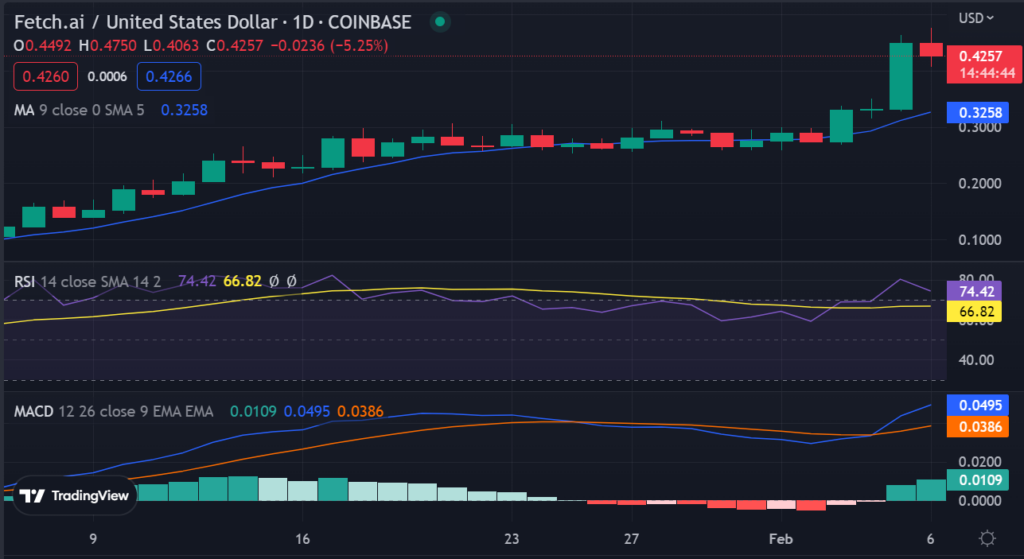
- A bullish pattern is forming on the daily chart.
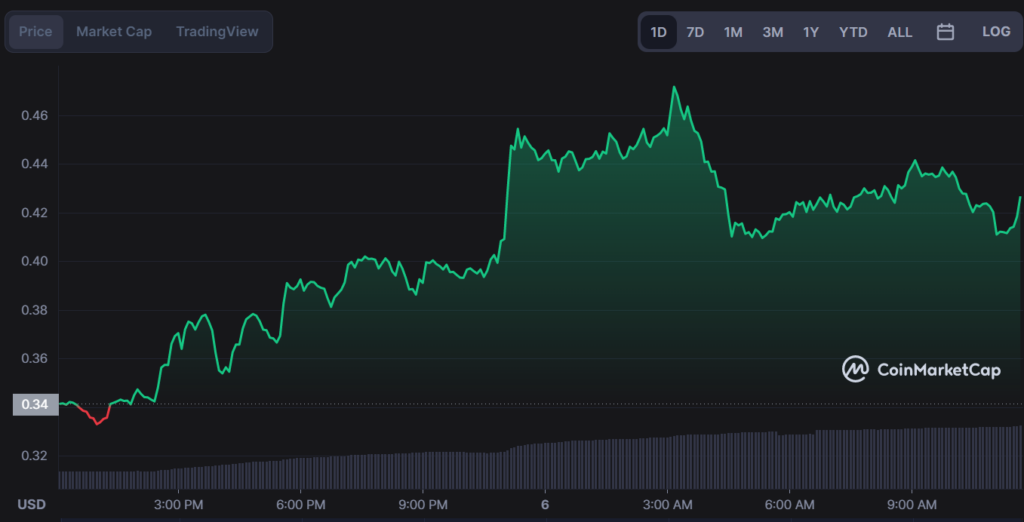
The FET/USD pair has been on a massive uptrend in recent days, with bulls pushing the price up by over 23%. The bullish momentum began after touching a low of $0.3550 and reaching a high of $0.4717 so far. At the time of writing, FET is trading at $0.4279, up by over 25% in the last week.
A look at the daily chart shows that a bullish pattern is forming and the price is facing resistance at the $0.4717 level. Further, it appears that bulls are holding their grip on FET as there have been higher highs and higher lows, with volume beginning to rise as well.
The FET/USD pair has seen an increase in trading volume as well. According to CoinGecko, the 24-hour trading volume of FET is currently at $446,288,837, up by nearly 287.17% in the last seven days. The surge in volume could indicate that more traders are entering the market, with bulls likely being in control of the current situation.
It is also worth noting that FET’s market capitalization has risen to $350,377,062 in the past week, indicating strong bullish sentiment among investors. With this being said, it is possible that FET could continue to rise higher if bulls can hold their grip on the market and extend their run. However, bears could take back control of the pair and drag it lower if they are able to push prices below the $0.3550 level.
On the technical indicators, the MACD is showing a bullish crossover and the RSI is in the overbought region. These indications suggest that bulls are firmly in control of the market and they could continue pushing prices higher if they can break through the resistance level.
FET/USD price analysis on the 4-hour chart shows that bulls are firmly in control. The 4-hour chart for FET/USD shows that the price is trading above all three major moving averages, indicating that the bulls are firmly in control of the market. Further, the RSI has moved into overbought territory, suggesting that more bullish momentum could be on its way.
The 200 SMA is in alignment with the 50 SMA as well, confirming that the uptrend is strong and could continue for some time.
For now, it looks like bulls will remain in control of FET/USD over the short term. If they can successfully break through the resistance level at $0.4717, then more gains could be seen. On the other hand, if they fail to break through then a short-term pullback could be seen.
The key support levels to watch will be $0.3550 and $0.3143, while the key resistance level is at $0.4717. Further movement in trading volume could also provide more clues about where the price might go next.
Disclaimer: The views and opinions, as well as all the information shared in this price analysis, are published in good faith. Readers must do their own research and due diligence. Any action taken by the reader is strictly at their own risk. Coin Edition and its affiliates will not be held liable for any direct or indirect damage or loss.
Disclaimer: The information presented in this article is for informational and educational purposes only. The article does not constitute financial advice or advice of any kind. Coin Edition is not responsible for any losses incurred as a result of the utilization of content, products, or services mentioned. Readers are advised to exercise caution before taking any action related to the company.


