


- Founder of Eight Global states that Altcoins are showing strength while DeFi is waking up.
- Fantom captures the ninth place in top gainers, according to CoinMarketCap.
- Polkadot has been moving sideways since November 10.
Chief Executive Officer (CEO) and Founder of Eight Global, Michael van de Poppe, stated that some altcoins are showing strength while decentralized finance is waking up.
Notably, Michael shared this as a follow-up tweet to the previous tweet, where he mainly highlighted FTM, AVAX, and DOT performing well.
In his tweet, Micheal mentioned:
As $FTM made a significant run, now also $AVAX and $DOT starts to look pretty good.
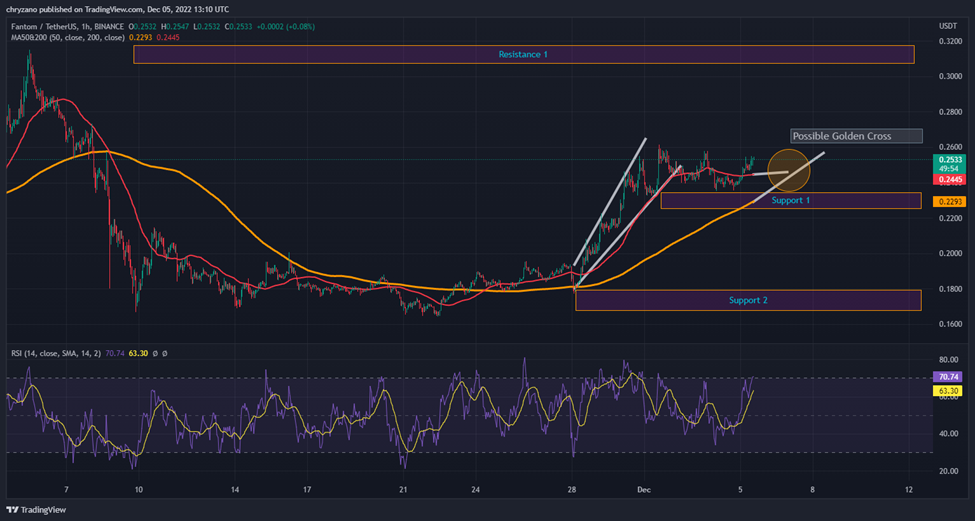
Meanwhile, Fantom (FTM) captured the ninth place for top gainers, according to CoinMarketCap. Fantom is up 5.00% in the last 24 hours and is trading at $0.252886.
As per the graph below, FTM had a roller coaster ride with its prices. During the last month, FTM recorded a maximum price of $0.3147 on November 5.
However, the prices fell to as low as $0.1675 in a matter of days. Interestingly, the 50-day MA from above seems to be converging with the 200-day MA depicting a possible golden, which could result in an uptrend. FTM may target hitting Resistance 1.
Contrastingly, if that (golden cross) doesn’t happen and the bears take over, then FTM may look to land on Support 1. Moreover, if the bears keep pushing, then FTM will land on Support 2.
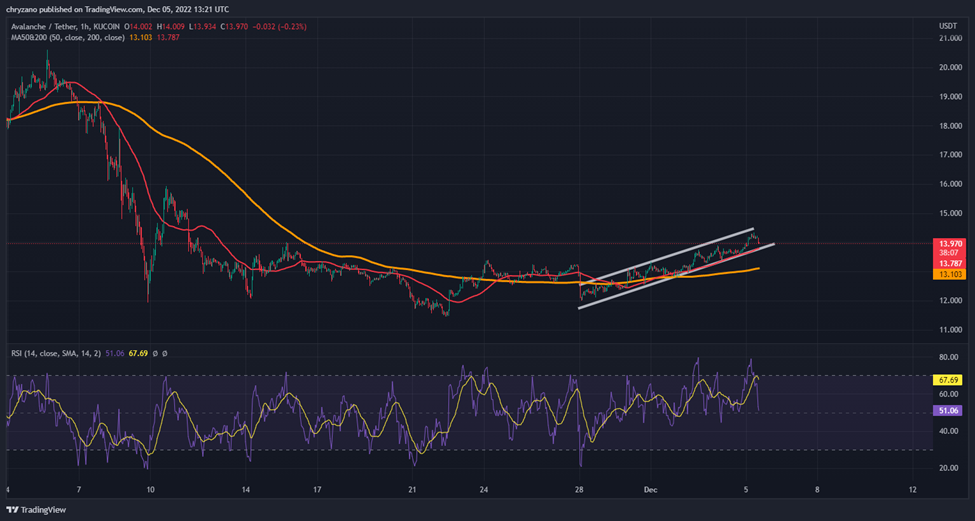
Furthermore, Avalanche (AVAX) is trading at $14.01, and it is up by 2.09% in the last 24 hours, according to CoinMarketCap.
As shown in the graph below, AVAX has been on a bull run since November 28. Moreover, the RSI index of AVAX is at 49.49, indicating that the trend is well set and the bullish run could continue. In addition to that the 50-day MA (red line) shows more potential and heading upward, while the 200-day MA (yellow line) seems to have gained some momentum after some lethargic horizontal movement.
Polkadot (DOT) has been moving sideways since November 10. As of press time, the price of DOT is $5.64, and it is up 2.00% in the last 24 hours, according to CoinMarketCap.
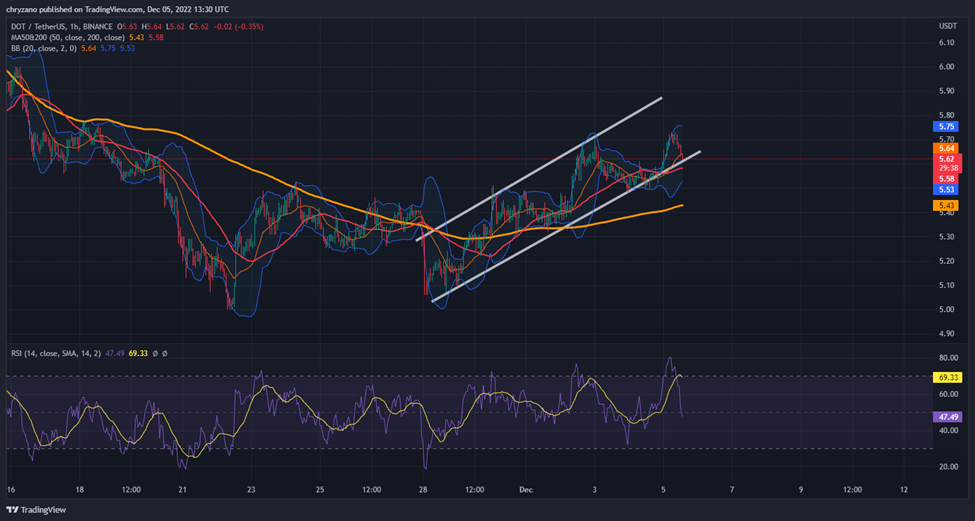
As shown in the graph above DOT is traversing a bull run. The 50-day MA (Red line) and 200-day MA (yellow line) are placed parallel to each other as they are titled up. And the RSI is at 49.78 which indicates that the trend will continue.
Disclaimer: The views and opinions, as well as all the information shared in this price analysis, are published in good faith. Readers must do their own research and due diligence. Any action taken by the reader is strictly at their own risk. Coin Edition and its affiliates will not be held liable for any direct or indirect damage or loss.
Disclaimer: The information presented in this article is for informational and educational purposes only. The article does not constitute financial advice or advice of any kind. Coin Edition is not responsible for any losses incurred as a result of the utilization of content, products, or services mentioned. Readers are advised to exercise caution before taking any action related to the company.
 Price Prediction 2026-2030: Will LTC Hit $80 Soon?")


 Price Prediction 2026, 2027, 2028, 2029, 2030-2050")
