


- FTM rises from $0.17 to $0.25 towards the latter part of November.
- The token is forming the cup handle; if the bulls push, FTM could hit Resistance 0.
- 200-day MA is parallel to the horizon while the Bollinger Bands are widening.
Fantom (FTM) has been doing quite well as it has been trading in the green zone mostly during the second half of November up until now. As shown in the chart below, the FTM price was moving sideways with very lethargic vertical movements.
However, come the last days of November, FTM gained some momentum and rose from $0.17 to $0.25 in less than two days. From the time that FTM gained momentum, it has been able to hold on to its position. Since the beginning of December, FTM was trading between $0.23 and $0.26.
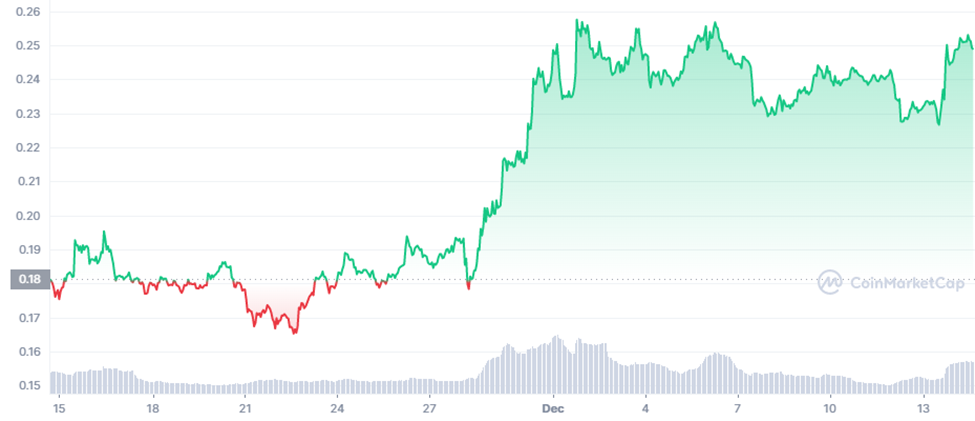
Fantom is up 6.85% in the last 24 hours and is trading at $0.2488, at press time, according to CoinMarketCap.
FTM was trading at $0.314 on November 5, and later on, FTM plunged to $0.166 within four days. Moreover, FTM’s prices took the form of a cup as depicted in the chart, However, now that the handle of the cup is forming, FTM is moving sideways.
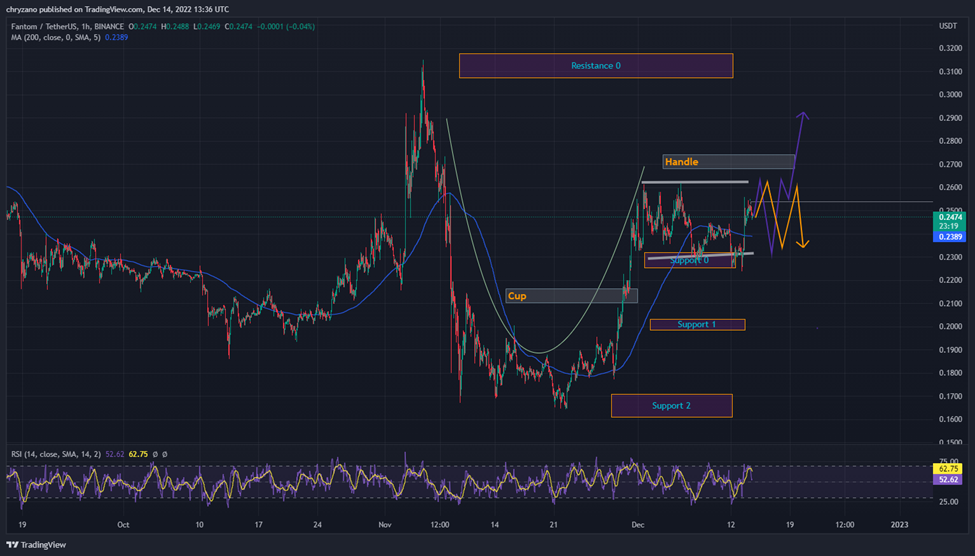
FTM tested the upper line of the handle positioned at $0.262 and it also tested Support 0 as depicted in the chart at $0.23. Notably, even during the few times when FTM broke the Support 0 it was able to recover its price.
Interestingly, the 200-day MA is parallel to the horizontal line, hence, there could be more sideways movement. Contrastingly, the Bollinger bands are widening, this depicts that there’s going to be more volatility. FTM has touched the lower Bollinger band, hence, the market could correct FTM’s price.
Additionally, the relative strength index is at 54.79, hence the trend is well set. If the bulls dominate the market, FTM would be looking to hit Resistance 0 at $0.30. But, if the bears take over the market, FTM would target landing on Support 0 positioned at $0.23.
Disclaimer: The views and opinions, as well as all the information shared in this price analysis, are published in good faith. Readers must do their own research and due diligence. Any action taken by the reader is strictly at their own risk, Coin Edition and its affiliates will not be held liable for any direct or indirect damage or loss.
Disclaimer: The information presented in this article is for informational and educational purposes only. The article does not constitute financial advice or advice of any kind. Coin Edition is not responsible for any losses incurred as a result of the utilization of content, products, or services mentioned. Readers are advised to exercise caution before taking any action related to the company.


 Price Prediction 2026, 2027, 2028, 2029, 2030-2050")