


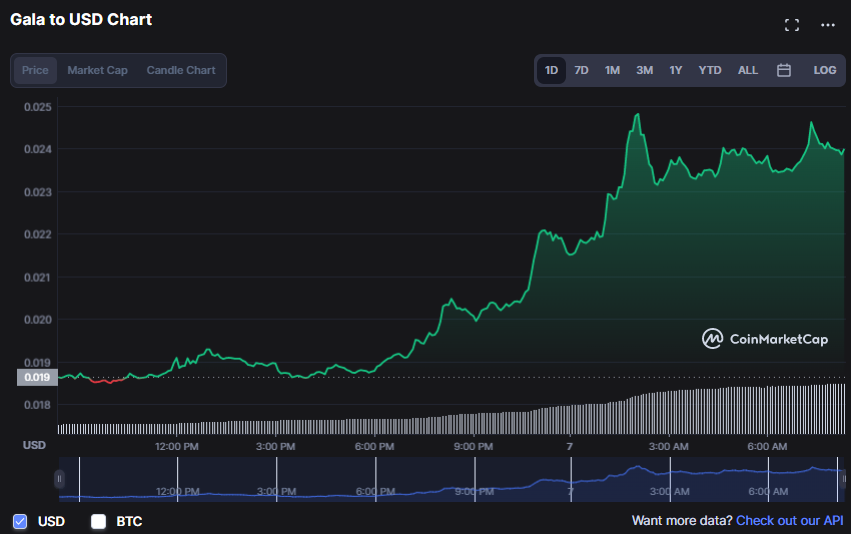
- Support at $0.01862 has halted the downward trend in GALA prices.
- Positive momentum over the previous 24 hours has increased the price by 29.23% to $0.02399.
- Will bulls be able to push over the present levels of resistance if the upward trend continues?
Gala (GALA) market bulls have assumed control after bears briefly pushed the price lower before hitting support at $0.0185.During this upswing, purchaser confidence pushed the price of GALA up by 29.23% to $0.02426 as time of writing.
The market capitalization increased to $172,042,304 and the 24-hour trading volume increased to $330,748,617, all of which are indicators of an optimistic market. Strong investor interest in the GALA market is shown by trading volume that exceeds market capitalization, indicating that prices will continue to rise higher if bulls maintain their momentum.
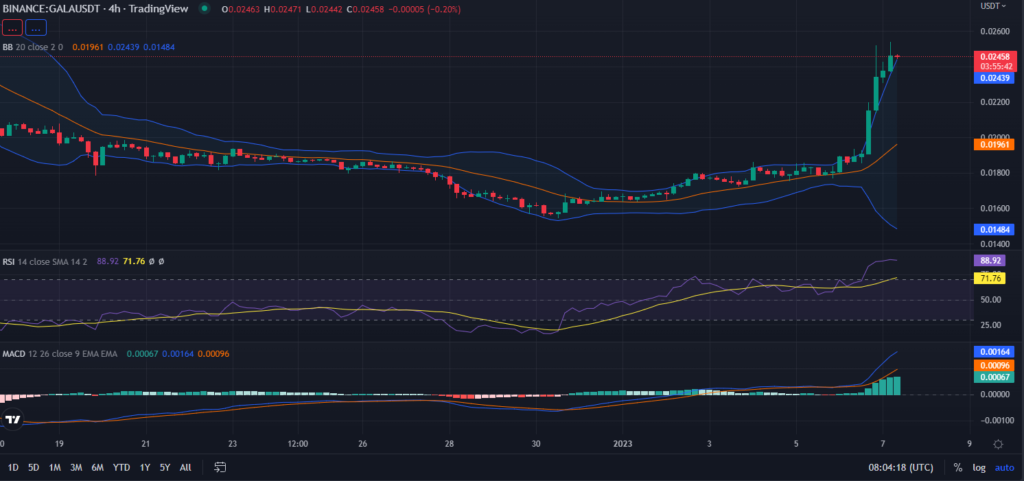
The Bollinger Bands, which are presently at $0.02346 at the upper band and $0.01510 at the lower band, represent the substantial growth in 24-hour trading activity. This shows that bulls’ power is growing, and if they maintain their present pace in the GALA market, the $0.02521 resistance level may be surpassed soon.
This influence of the bulls is seen on the Relative Strength Index (RSI), which shows an overbought level of 89.60. Traders should be wary of this sentiment, however, since bullish sentiment is expected to be at its peak right now. This RSI movement warns traders to keep an eye out for a possible short-term resurgence of bearish momentum.
With a MACD blue line trend in the positive area and a value of 0.00147, the GALA market’s negative RSI forecast is muted. With such a bullish outlook, the price of GALA is likely to continue rising; adding on, the histogram’s current upward trend provides more evidence that the bulls’ strength is still strong rising traders hopes for a protracted bull run.
The Aroon indicator motion also indicates a strong uptrend, with the Aroon-Up and Aroon-Down lines crossing above each other at 92.86% and 35.71%, respectively, suggesting that the bull run may continue. If this pattern continues, the upward movement suggests that the bull market may continue for some time. The continuous market growth for GALA is expected to continue as the Aroon-Up line expands.
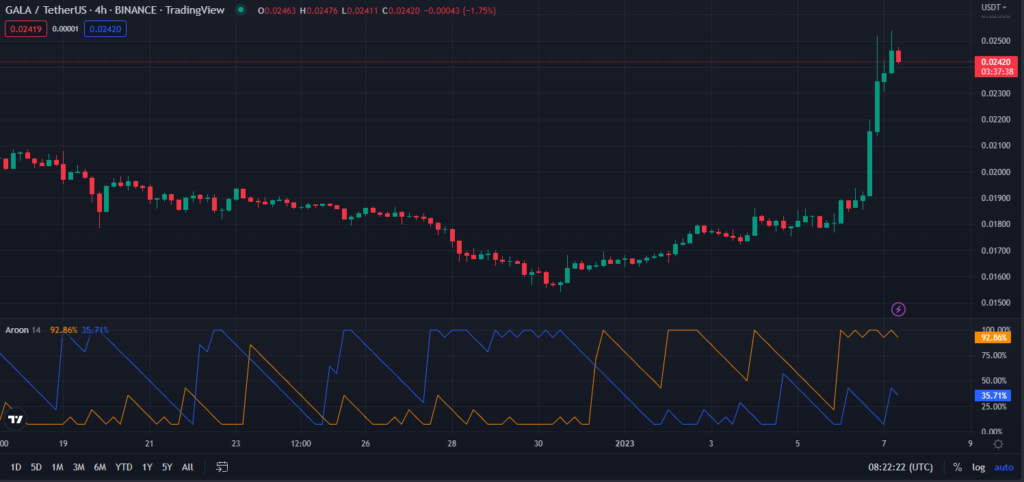
If bulls in the GALA market can continue to push prices over recent resistance, even bigger gains may be possible in the near future.
Disclaimer: The views and opinions, as well as all the information shared in this price analysis, are published in good faith. Readers must do their own research and due diligence. Any action taken by the reader is strictly at their own risk, Coin Edition and its affiliates will not be held liable for any direct or indirect damage or loss.
Disclaimer: The information presented in this article is for informational and educational purposes only. The article does not constitute financial advice or advice of any kind. Coin Edition is not responsible for any losses incurred as a result of the utilization of content, products, or services mentioned. Readers are advised to exercise caution before taking any action related to the company.
 Price Prediction 2026-2030: Will TRX Hit $0.50 Soon?")
 Price Prediction 2026-2050: Will HYPE Hit $100 Soon?")


: What Happens If You Use an Unlicensed Platform?")