


- Gala price analysis shows a strong bullish trend today, with a high of $0.03915.
- GALA has gained more than 66.30% over the past 24 hours.
- The coin is trading in a range of $0.02333 and $0.03926 in the last 24 hours.
Gala price analysis is highly bullish for today as the buying momentum has been continuously growing today. The GALA/USDT pair is currently trading at $0.03715 and is making a strong move towards the next resistance level at $0.03926, if it manages to break above this level, then it might reach as high as $0.04 in the near future.
The coin has also gained more than 66.30% over the past 24 hours and is currently trading in a range of $0.02333 and $0.03926 in the last 24 hours.
The bullish momentum is primarily driven by the increase in volume of trading and demand for GALA tokens. According to data from CoinMarketCap, the 24-hour trading volume of the crypto is currently at $963 million, with more than 464% increase from the previous day. In terms of market cap, GALA has a market cap of $260 million and is currently ranked at #97 on CoinMarketCap list of cryptocurrencies.
The daily Gala price analysis confirms a bullish trend for the market as the price covered an upward movement in the past 24-hours. The buyers are in control of the market and if they maintain the current momentum, then we could see a surge in GALA price towards the upcoming resistance levels.
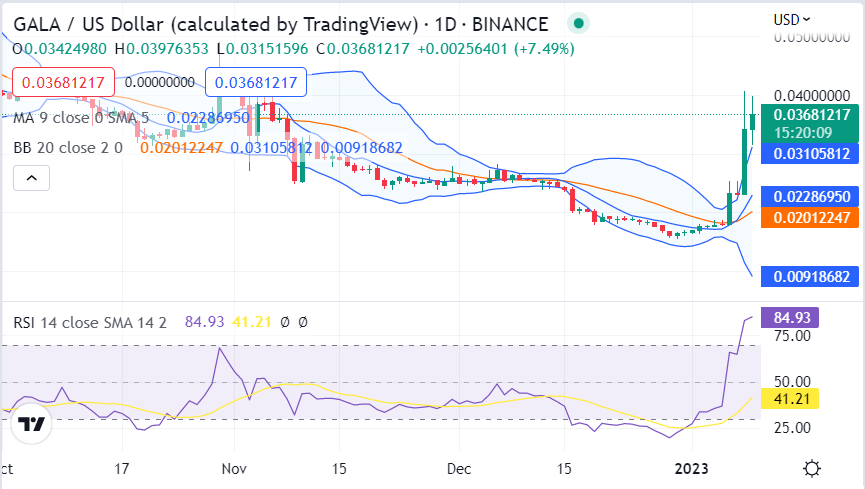
GALA/USD 24-hour trading chart: Source: TradingViewThe moving average (MA) value is currently set at 0.022 which is a strong indication that the buyers are in control of the market. As the area between the Bollinger bands is widening, it is a clear indication that the market volatility is increasing and traders should be careful while trading in the near future.
The upper Bollinger band is currently placed at 0.0310 while the lower Bollinger band is currently placed at 0.009. The relative strength index (RSI) is trading at an upward slope at index 41.21, hinting at the buying activity in the market.
The four-hour Gala price analysis supports the buyers as the price experienced a good increase in price in the first four hours of today’s trading session. This is because the bulls have made a comeback and are striving hard to win back their lead.
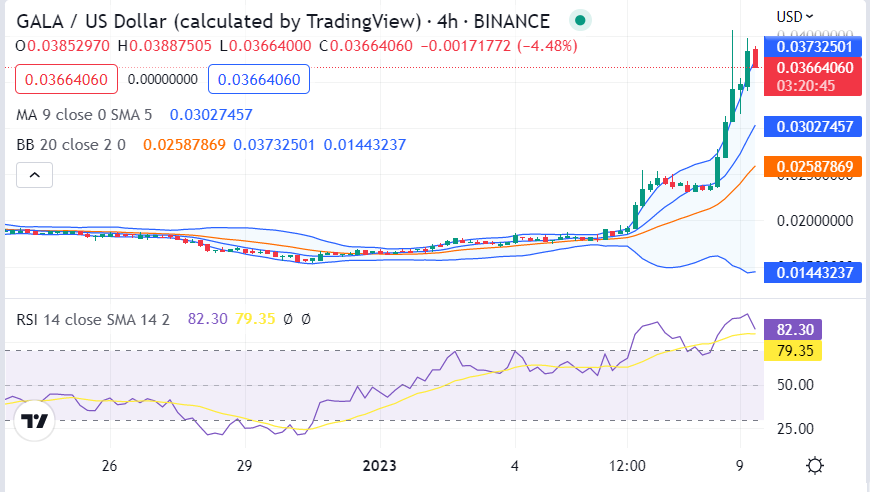
GALA/USD 4-hour trading chart: Source: TradingViewLooking at the hourly technical indicators, the upper Bollinger band is currently placed at 0.0373 while the lower Bollinger band is currently placed at 0.0144, indicating that the bullish trend is likely to continue in the near future. The Relative Strength Index (RSI) graph shows a bullish curve as the score just rose to 79.35, indicating that the buying activity is increasing. The Moving average is currently at 0.030 on the chart.
To sum up, GALA/USD pair is currently in a bullish trend and could go higher if the buyers maintain their current momentum. The technical indicators are also backing the bulls and traders can look at the upcoming resistance levels to capitalize on this trend.
Disclaimer: The views and opinions, as well as all the information shared in this price prediction, are published in good faith. Readers must do their research and due diligence. Any action taken by the reader is strictly at their own risk. Coin Edition and its affiliates will not be held liable for any direct or indirect damage or loss.
Disclaimer: The information presented in this article is for informational and educational purposes only. The article does not constitute financial advice or advice of any kind. Coin Edition is not responsible for any losses incurred as a result of the utilization of content, products, or services mentioned. Readers are advised to exercise caution before taking any action related to the company.
 Price Prediction 2026-2030: Will LTC Hit $80 Soon?")


 Price Prediction 2026, 2027, 2028, 2029, 2030-2050")
