
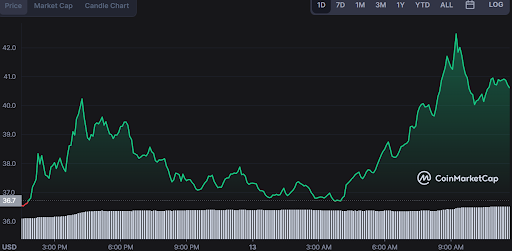
- GMX has been trending higher this week, with prices reaching new highs on multiple occasions.
- The latest resistance level can be found at $42.51, while support is currently at $36.46.
- GMX enters a consolidation phase as it looks to break this resistance and continue its bullish momentum.
Recent GMX price analysis reveals the token has been on a strong bullish momentum after opening the daily trading session above the 50-day SMA. A higher-high was recorded at $41.93, but the price has since retreated to test support levels around the 50-day SMA and the 200-day EMA.
GMT token is currently trading at $39.19, with a trading volume of $40,960,738.26.The token is ranked position 89, with a market dominance of 0.04%.GMX token is facing a firm rejection at the 21-day EMA, but bulls still appear to be in control on the long-term chart.
Looking ahead, we can expect a break of $42.51 resistance to push prices towards $50.00, where sellers are likely to emerge. If prices break below support at $36.46, then the further downside is limited by the confluence of the 38.2% Fibonacci retracement level and the ascending trendline.
In order to benefit from this bullish price action on GMX, traders should look for a break above resistance at $42.51 with a stop-loss at $36.46. Long positions should be closed if support at $36.46 is broken.
Alternatively, traders could open short positions if prices break below support at $36.46 with a stop loss at $42.51 for an extended downside move. Short positions should be closed if prices break above resistance at $42.51, or the ascending trendline from the October 14 low of $35.57.
Looking at the technical analysis on the 4-hour and the hourly timeframes, the GMX token has formed a bullish pennant and may be poised for a strong move to the upside. The bullish pennant is formed when a sustained move to the downside exhausts itself and leads to the consolidation of prices.
GMX technical indications on the daily chart show that a bullish reversal is likely, with the 21-day EMA crossing above the 50-day SMA and the MACD indicator moving higher.
With market volatility on the rise, traders should use tight stop losses to capture any short-term moves in prices. The Bollinger bands are starting to widen, which is an early indicator that the market may be poised for further volatility in the coming days.
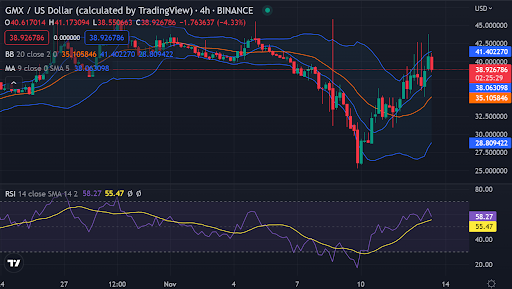
Further technical indications show the Relative Strength Index (RSI) indicator moving higher, which reflects that buyers are in control. The MACD indicator is moving higher and may soon cross above the signal line, which could trigger further buying pressure in the market.
The short-term trend is bullish while long-term trend is also bullish. A break of $42.51 resistance could lead to a further rise towards $50.00 where sellers are likely to emerge. On the other hand, a break of $36.46 support may lead to further downside in prices.
Disclaimer: The information presented in this article is for informational and educational purposes only. The article does not constitute financial advice or advice of any kind. Coin Edition is not responsible for any losses incurred as a result of the utilization of content, products, or services mentioned. Readers are advised to exercise caution before taking any action related to the company.
")


