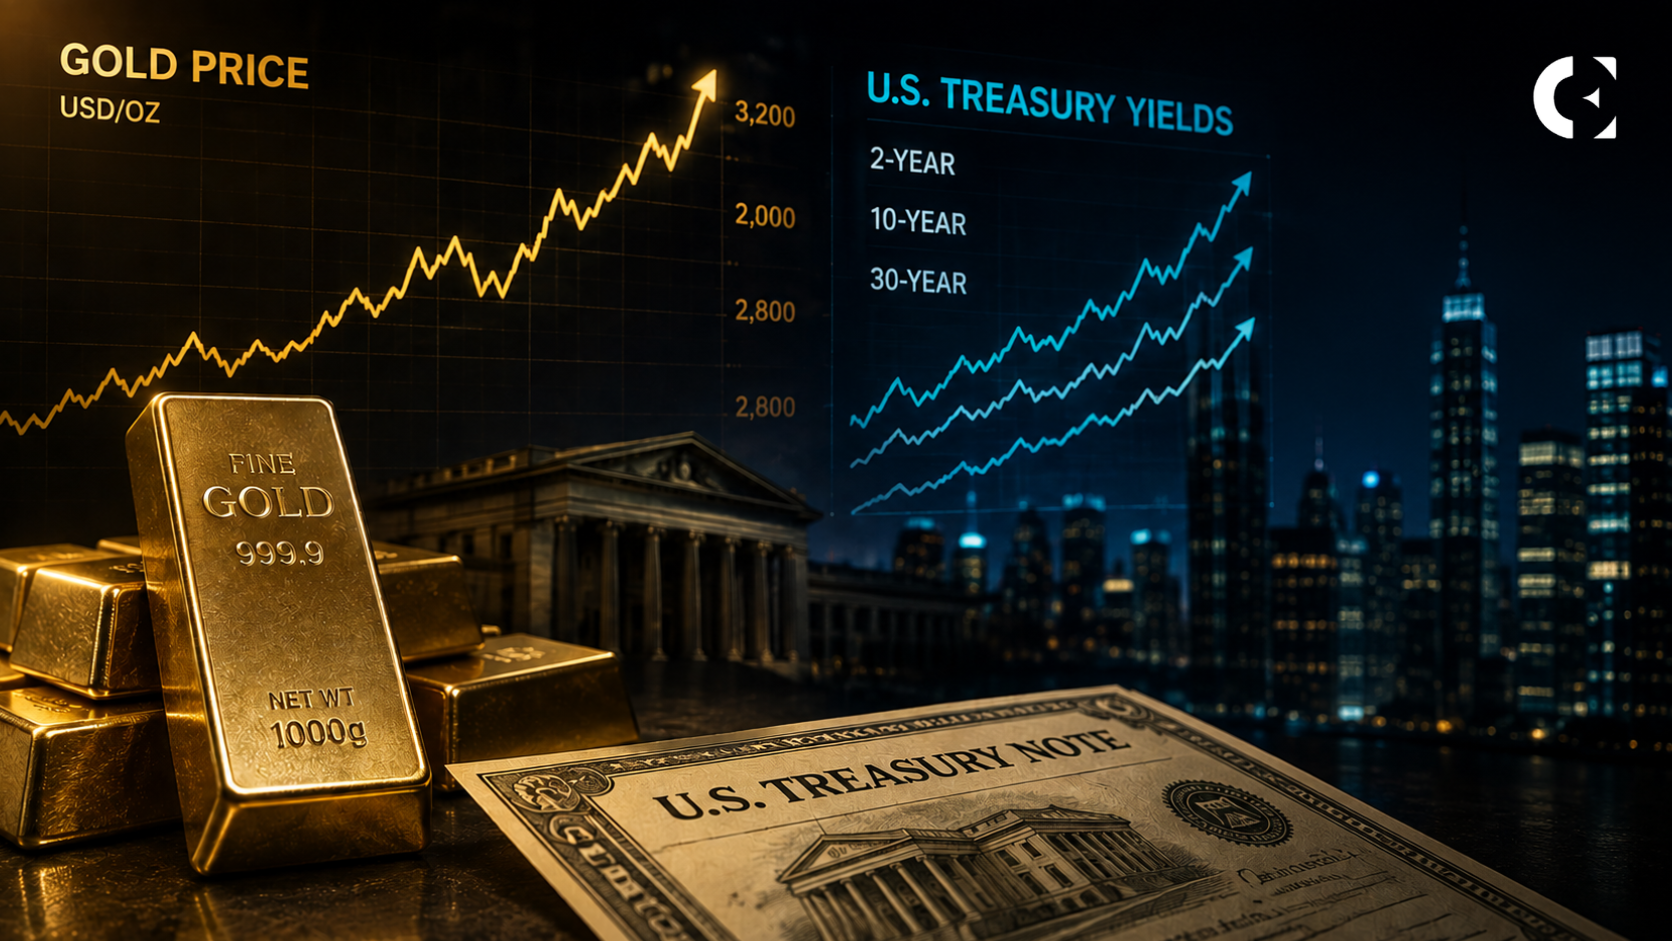

- Gold spot reached $4,626.80, while futures climbed to $4,684.91 in the supplied charts.
- Peter Schiff said gold’s rise reflects inflation concerns and Fed policy bets.
- Foreign official institutions sold $9.8 billion of Treasury notes and bonds in June.
Gold pushed above $4,600 while the 10-year Treasury yield reached 4.74%. That pairing creates an important question about market expectations. Higher yields usually raise the opportunity cost of holding bullion, which pays no interest. Their joint rise suggests a more complex trade than a simple bet on rate cuts.
Peter Schiff presented the move as evidence of inflation anxiety and expected Federal Reserve easing. He also argued that foreign governments were selling Treasuries and buying gold. The price action confirms his observation, but not its cause. The available records provide only partial support for his explanation.
Gold Confirms the Move but Not the Motive
The supplied TradingEconomics chart placed spot gold at $4,626.80, up 37.17% over one year. The rebound followed a summer slide toward $4,000. The World Gold Council recorded a January high of $5,405. The August move remained a recovery below that peak.
Analyst Ian Cooper’s chart adds a technical reason for the rally. It shows price breaking a falling trendline and testing $4,600. Cooper requires a daily close above resistance before targeting $4,850. The RSI near 70 records strong momentum and a stretched short-term position.
Those signals explain why traders may buy a breakout. They cannot identify governments as buyers or inflation as the sole motive. The supplied Investing.com futures chart reached $4,684.91 after a 2.48% session gain.
Gold Demand Gives Schiff Partial Support
The World Gold Council estimated central banks purchased 289 tonnes during the second quarter. That figure supports Schiff’s broad premise that official institutions continue buying gold. However, the same report recorded 45 tonnes of ETF outflows. Total demand, including over-the-counter trading, remained unchanged yearly at 1,269 tonnes.
Mixed category flows show that gold’s price does not require every investor group to buy simultaneously. Central banks and OTC buyers can set marginal prices while exchange-traded funds reduce holdings. Safe-haven demand, technical buying, currency moves, and portfolio hedging can also raise bullion.
The council’s July revision also warns against confident buyer attribution. It cut estimated first-quarter central-bank demand from 244 tonnes to 57 tonnes. It reclassified 187 tonnes as OTC and other demand. The reports also end in June, before the latest August rally.
Rising Yields Do Not Identify the Seller
Treasury data show the 10-year yield rising from 4.65% on August 19 to 4.74% on August 21. The 30-year yield moved from 5.19% to 5.27%. Since yields move inversely to prices, longer-dated Treasury prices fell. Schiff correctly identified that market-level move, but yields do not identify sellers.
Federal Reserve research separates long yields into expected short-term rates and a term premium. Inflation expectations can raise yields, but growth expectations and risk compensation can also do so. Schiff’s mechanism remains plausible, but the yield curve does not prove it alone.
The Fed’s July minutes add another divergence. Officials held the policy rate at 3.50% to 3.75% by a 9-3 vote. Three members preferred a quarter-point increase, while the committee called inflation elevated. Markets may expect later easing, but the minutes do not establish a completed dovish turn.
Foreign Flows Show Rotation Rather Than a Broad Exit
Meanwhile, the asset-level Treasury International Capital report gives the closest support to Schiff’s official-selling claim. Foreign official institutions sold $9.8 billion of Treasury notes and bonds in June. They also sold $35.6 billion of Treasury bills. Those figures show that official holders reduced Treasury exposure that month.
The same table also qualifies the claim. Official institutions bought $11.7 billion of corporate bonds and $36.7 billion of equities. They purchased $37.3 billion of long-term US securities on net. Their total US financial inflow reached $48.4 billion after short-term securities and banking flows.
Private foreign investors bought $16.6 billion of Treasury notes and bonds. Combining both columns produces a $6.8 billion net foreign purchase of those securities. June therefore records official portfolio rotation, not a generalized foreign exit from US assets.
Treasury also warns that custodial records cannot assign final country ownership with complete accuracy. The June report predates the August gold rally and cannot trace sale proceeds into bullion. Treasury will release July TIC data on September 16, offering a closer test of whether official selling persisted.
Related: SGB Exit Window Could Trigger Gold Selling Pressure as Investors Lock In Gains
Disclaimer: The information presented in this article is for informational and educational purposes only. The article does not constitute financial advice or advice of any kind. Coin Edition is not responsible for any losses incurred as a result of the utilization of content, products, or services mentioned. Readers are advised to exercise caution before taking any action related to the company.