


- GRT market faces selling pressure, but indicators hint at a bullish reversal.
- A critical support level at $0.1149 may determine GRT’s price trajectory.
- Formation of bullish flag pattern on GRT chart signals potential breakout.
In the past 24 hours, the Graph (GRT) market has experienced a period of selling pressure, resulting in a decline from its 24-hour high of $0.1222 to find support at $0.1149. At press time, bearish momentum continues to dominate the GRT market, leading to a slight dip of 1.66% to $0.1178.
The critical level to watch is the breach below $0.1149, which could trigger further selling and potentially push GRT’s price to another support level at $0.1100. However, if the support holds firm, it may indicate a consolidation phase where buyers step in, intending to increase prices.
This consolidation phase could lead to a rebound in the GRT market, with resistance levels at $0.1222 and $0.1250. A successful break above these resistance levels would signal a bullish trend reversal, attracting more buyers to enter the market. In such a scenario, GRT may experience a significant rally, aiming for the next resistance level at $0.1300.
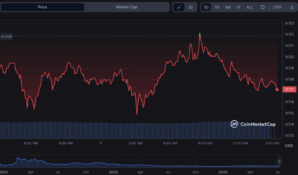
GRT/USD 24-hour price chart (source: CoinMarketCap)
While GRT’s market capitalization has experienced a 1.57% drop, at $1,068,182,181, the 24-hour trading volume has seen an 8.24% dip to $51,798,825. These fluctuations indicate the ongoing volatility in the market, creating opportunities for buyers and sellers to take advantage of the prevailing conditions.
Analyzing the GRTUSD 2-hour price chart, the stochastic RSI shows a positive shift above its signal line, recording a reading of 40.23. This shift suggests that the negative momentum may weaken, paving the way for a more favorable market sentiment surrounding GRT.
Additionally, the MACD indicator indicates convergence, with the histogram narrowing and the signal line approaching the zero line. These technical indicators imply that GRT may be on the verge of a bullish reversal in the short term.
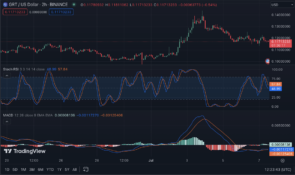
GRT/USD price chart (source: TradingView)
Furthermore, GRT has recently formed a bullish flag pattern on the daily chart. This pattern typically represents a temporary consolidation before a continuation of the previous uptrend. If GRT manages to break out above the upper trendline of this flag pattern, it could trigger a surge in buying pressure, propelling the price toward new highs.
In conclusion, although the Graph (GRT) market has faced selling pressure recently, various technical indicators suggest a potential bullish reversal. The formation of a bullish flag pattern and the positive shifts in stochastic RSI and MACD signal a changing market sentiment.
Disclaimer: The views, opinions, and information shared in this price prediction are published in good faith. Readers must do their research and due diligence. Any action taken by the reader is strictly at their own risk. Coin Edition and its affiliates will not be liable for direct or indirect damage or loss.
Disclaimer: The information presented in this article is for informational and educational purposes only. The article does not constitute financial advice or advice of any kind. Coin Edition is not responsible for any losses incurred as a result of the utilization of content, products, or services mentioned. Readers are advised to exercise caution before taking any action related to the company.

: What Happens If You Use an Unlicensed Platform?")


