


 May Have Flashed a Bounce")
- A popular analyst pointed out a 50% upside potential for BTC due to the price position around the 100 MA.
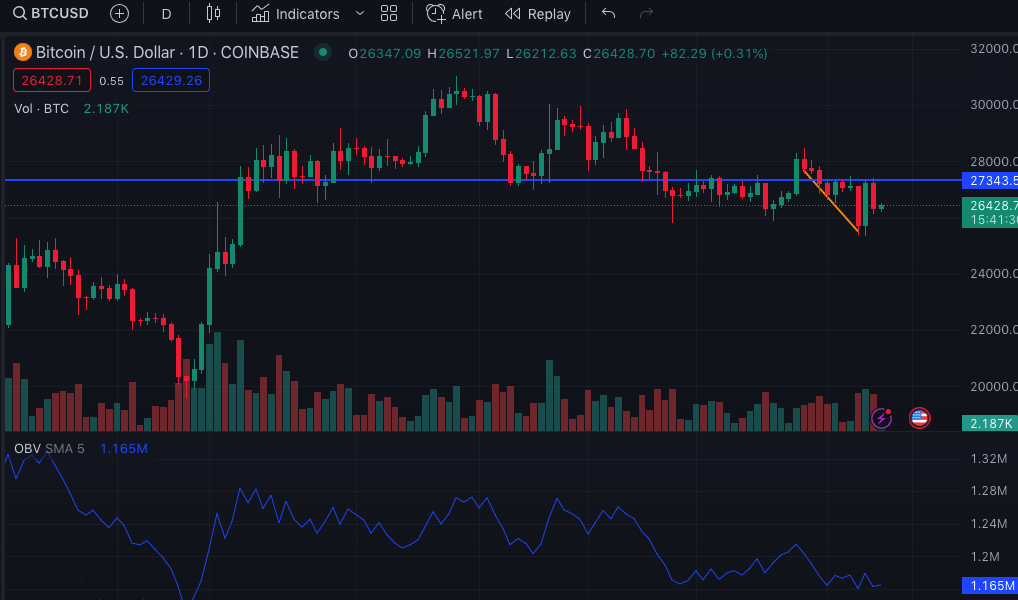
- BTC might need more demand at $26,400 to overcome the series of false breakouts.
- The OBV aligned with a bearish market structure since liquidity decreased and the price continued fluctuating.
Crypto analyst Tone Vays stated that Bitcoin’s (BTC) drop should not be a reason for traders to fret. The analyst who hosted a live session with his YouTube community said the $27,500 region has a role to play in his projection.
While explaining how he arrived at a 50% bullish allocation, Vays said, “The region is the catalyst to be 100% bullish in Bitcoin. If we go above $27,500 and close above the red candle, then I would be comfortable that we’re in the bullish market once again.”
BTC Requires an Increase in Buy Orders
Prior to his latest analysis, Vays told his 123,000 subscribers that the SEC hunt on exchanges would not negatively impact BTC for a long while.
And his prediction became reality. After the market decline on the Binance lawsuit announcement, BTC’s price dropped. But when the regulatory commission added Coinbase to the group of exchanges currently probed, the coin rose above $27,000.
Though Bitcoin has retraced to $26,464 at press time, the analyst mentioned that the upward movement also depends on the 100-day Moving Average (MA).
By examining the Bitcoin price patterns, and key support levels, Vays noted, “I am very very bullish. But the bullishness of the daily chart needs to align with the bullishness of the four-day chart while crossing the 100 MA for a potential price rebound.”
However, this could happen if the buying pressure on the $26,400 to $27,500 price level buying pressure outweighs the selling pressure.
Bearish Tendencies
According to the daily chart, recent price fluctuation led BTC to lose support from $27,673 on May 29 to $25,515 on June 5. In between the drop in support level, there was a false breakout at $27,343.
However, findings from the On-Balance-Volume (OBV) showed that the market structure was bearish. Earlier in May, the liquidity hunt in the market saw the OBV spike, and, in turn, pushed a breakout.
But the current downward tide suggests that distribution could be taking place. Hence, traders should be wary of a continuous downward movement. However, an increase in the OBV could turn things around and align with Vays’ projection.
In another interesting development, Lookonchain disclosed that a Bitcoin whale recently activated a 10-year-old wallet, and moved $37.8 million worth of the coin to another wallet. Although there is no confirmation yet that the intent is to sell, speculation thrives that BTC could face another downside.
Disclaimer: The views, opinions, and information shared in this price prediction are published in good faith. Readers must do their research and due diligence. Any action taken by the reader is strictly at their own risk. Coin Edition and its affiliates will not be liable for direct or indirect damage or loss.
Disclaimer: The information presented in this article is for informational and educational purposes only. The article does not constitute financial advice or advice of any kind. Coin Edition is not responsible for any losses incurred as a result of the utilization of content, products, or services mentioned. Readers are advised to exercise caution before taking any action related to the company.
 Price Prediction: Can BTW Sustain Its Breakout Above $0.1032?")


