


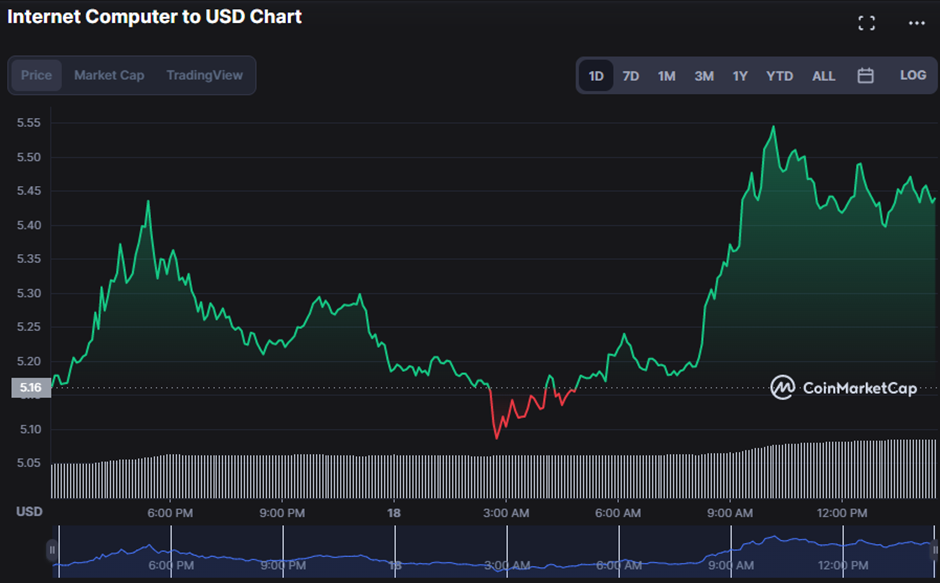
- In the recent 24 hours, bear attempts to take over the ICP market lowered the price to $5.08.
- In order to hit new heights, bulls must overcome the $5.54 resistance.
- Technical indicators caution traders of a near-term turnaround.
Bullish strength is at its pinnacle in the Internet Computer (ICP) market as the price correction tries to reverse the price to its three-month high of $5.79 as it approaches $5.54 in the previous 24 hours. This bullish run effectively lifted the ICP price by 4.90% to $5.43 at the time of publication.
Market cap climbed by 5.14% to $1,542,093,808, and 24-hour trading volume increased by 71.16% to $57,891,950, both indicative of rising investor confidence and strong demand.
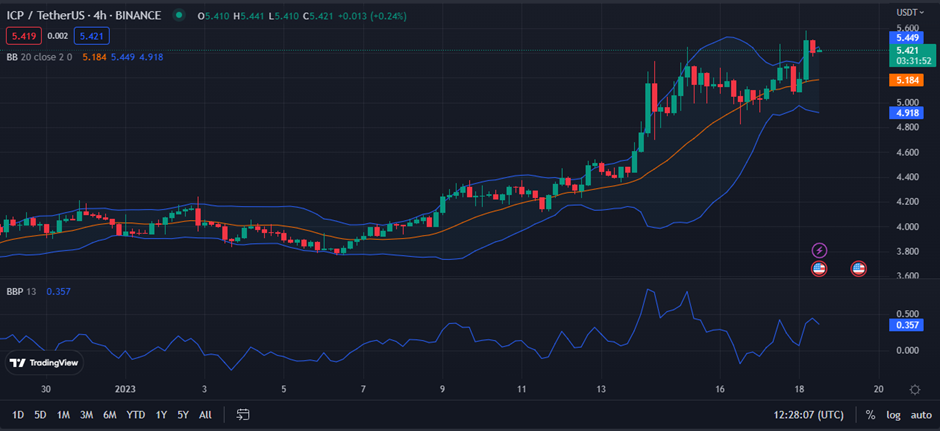
The Bollinger Bands are bulging on the 4-hour price chart, with the upper band at $5.449 and the lower band at $5.918 indicating greater market volatility. With the price nearly surpassing the upper band at $5.430, it is an indication that the market may be headed for a pullback; however, it is developing a green engulfing candlestick, indicating that the bulls are taking control of the market and pushing the price higher, suggesting that the uptrend may be continuing.
A Bull Bear Power (BBP) rating of 0.355 and a downward slope on the ICP price chart signal that market sentiment is likely to move to the negative side. Despite the fact that the ICP price chart shows a reading of 0.355, it is still in the positive zone, suggesting that there is still room for additional development before entering a bear market, raising hope for more price gains.
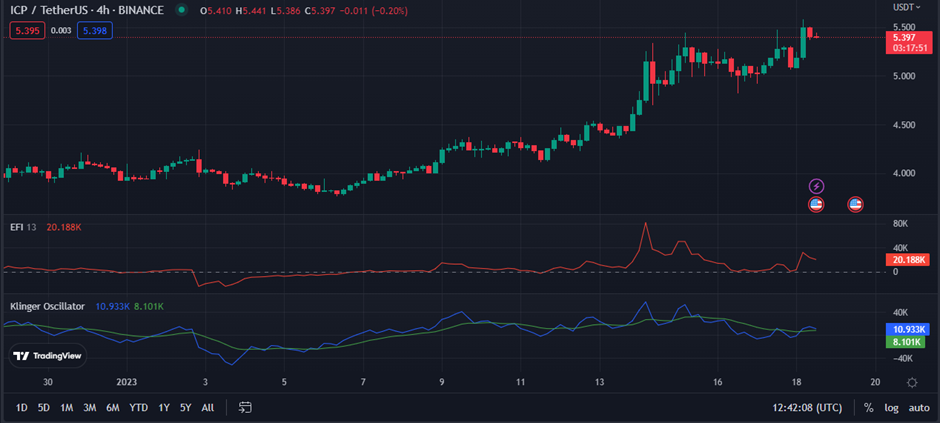
The Elder Force Index (EFI) value of 20.26k on the ICP chart represents a bullish market trend and predicts that stock prices are expected to rise. This movement indicates that bulls are still in charge of the market, and the high EFI reading reflects the strength of their position. However, the advancement of the EFI line southward may indicate that bullish pressure is fading and a bearish takeover is approaching.
By advancing higher in relation to its signal line, the Klinger Oscillator’s reading of 11.3k suggests that the market may be in a bullish phase. This move suggests that momentum and relative strength are firmly in the hands of buyers, leading to the expectation of more price rises in the ICP market.
If bullish strength is to last, bulls must fight to retain the resistance level and drive prices higher.
Disclaimer: The views and opinions, as well as all the information shared in this price analysis, are published in good faith. Readers must do their own research and due diligence. Any action taken by the reader is strictly at their own risk, Coin Edition and its affiliates will not be held liable for any direct or indirect damage or loss.
Disclaimer: The information presented in this article is for informational and educational purposes only. The article does not constitute financial advice or advice of any kind. Coin Edition is not responsible for any losses incurred as a result of the utilization of content, products, or services mentioned. Readers are advised to exercise caution before taking any action related to the company.


