


- OMG is seeing bearish momentum as bulls succumb to resistance.
- Indicators urge traders to put a stop loss order to limit possible losses.
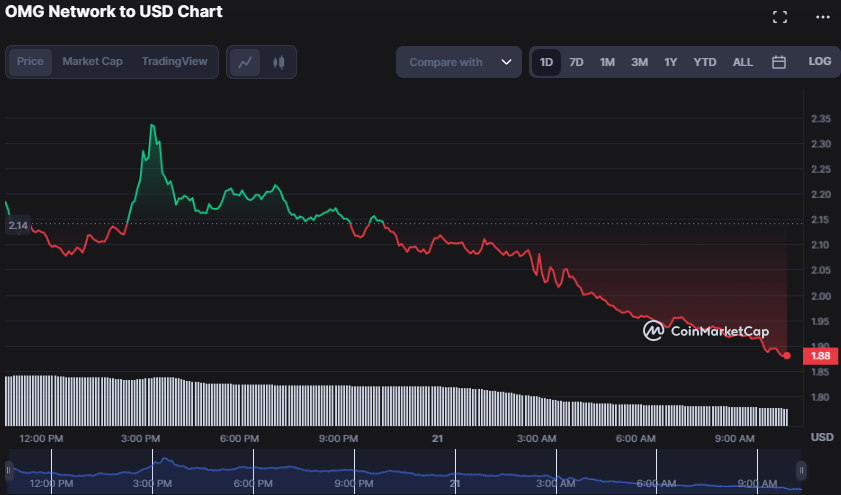
- OMG has found support at $1.88 and resistance at $2.34 in the past 24 hours.
Bullish momentum in the OMG Network (OMG) faded when bulls failed to break through resistance at the intraday high of $2.34. Due to this failure, bears took control of the market and managed to drive the OMG price down to a 24-hour low of $1.88, which was the value as of press time, marking a 12.62% drop.
The drop in the price of OMG might be linked to profit-taking by short-term traders who capitalized on the positive trend earlier in the day. As a result, the market capitalization and 24-hour trading volume fell by 13.41% and 65.41%, to $264,409,223 and $373,031,756, respectively.
If the bearish trend continues, the $1.88 support level may be broken, and the following support levels may be located at $1.80 and $1.75, resulting in more selling pressure in the market.
But, if bulls regain market control and the $2.34 resistance level is broken, the price may go towards the subsequent resistance levels at $2.50 and $2.70, attracting additional buyers and increasing the market’s positive momentum.
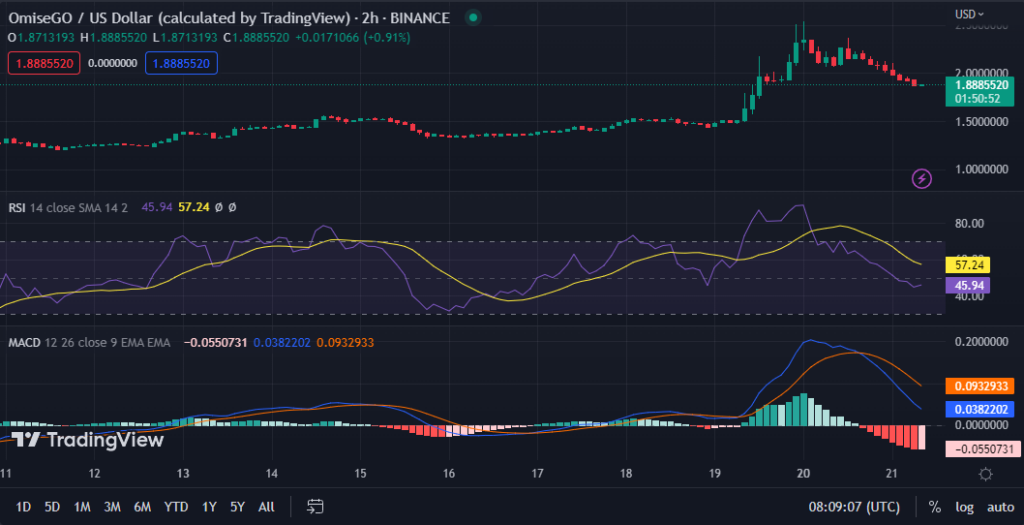
On the OMG 2-hour price chart, the Relative Strength Index (RSI) is trending below its signal line with a value of 44.80, approaching the oversold zone of 30. This move signals that the current bear rule in OMG may last a little longer, and traders should be cautious before establishing any long positions until the RSI indicates a probable reversal.
The MACD line also slides below its signal line and into negative territory, with a value of 0.0372640, adding to the gloomy picture. This movement indicates that bear power is rising, and the price may continue to fall soon, creating a possible opportunity for short-selling.
The histogram trend is negative, indicating that selling pressure is increasing, and the price may have additional downward potential.
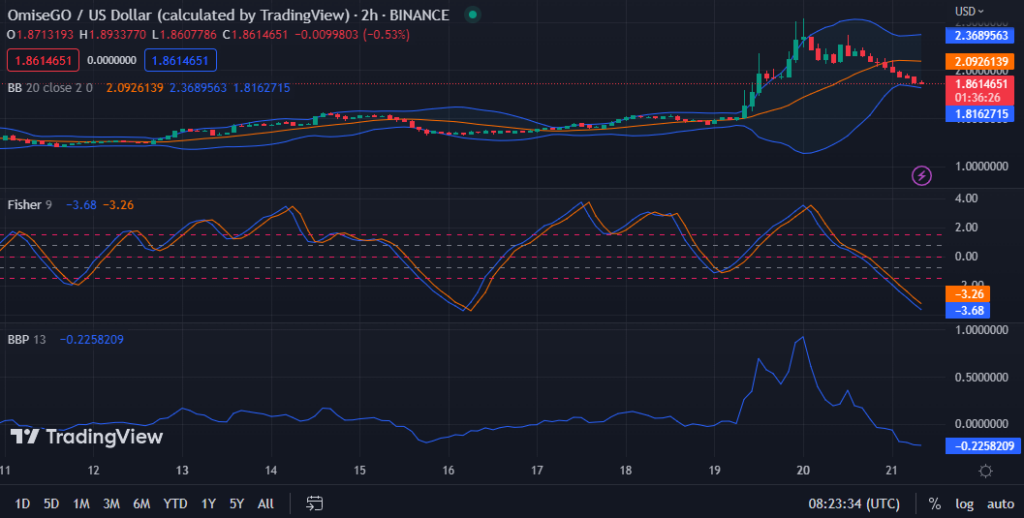
While the Bollinger bands are expanding the negative momentum in the OMG market, traders may consider shorting OMG to take advantage of the downward trend while establishing a stop loss above the upper Bollinger band to minimize risk. The top band contacts at 2.3674781, while the lower band touches at 1.8188315, representing this motion.
The Fisher Transform trend is below its signal line with a value of -3.68, indicating that the market is oversold and that there may be a possible buying opportunity. Still, traders should wait for confirmation before placing any transactions.
With a value of -0.2228581, the Bull Bear Power trending in the negative area further reinforces the oversold market state and shows that bears are now in power. This trend urges traders to wait for a bullish signal or a reversal pattern before taking any long positions since the market may continue to fall soon.
Despite indicators predicting a long bear rally, bulls must continue striving to overturn the OMG market’s negative trend.
Disclaimer: The views, opinions, and information shared in this price prediction are published in good faith. Readers must do their research and due diligence. Any action taken by the reader is strictly at their own risk. Coin Edition and its affiliates will not be liable for direct or indirect damage or loss.
Disclaimer: The information presented in this article is for informational and educational purposes only. The article does not constitute financial advice or advice of any kind. Coin Edition is not responsible for any losses incurred as a result of the utilization of content, products, or services mentioned. Readers are advised to exercise caution before taking any action related to the company.


 Price Prediction 2026, 2027, 2028, 2029, 2030-2050")

