


- TIA’s dip to $15.63 signals a 5.03% drop in 24 hours, positioning Celestia at 34 with a $2.5B market cap.
- MACD’s bullish crossover suggests potential upward momentum for TIA, while Aroon indicators favor an uptrend.
- Celestia’s MFI signifies a balanced market, indicating sustainable growth and investor confidence in TIA amidst market volatility.
Celestia has emerged as a significant player, particularly noted for its innovative approach to blockchain architecture. Its native token, TIA, currently valued at $15.63, reflects a recent downturn after peaking at around $20 in early 2024. This decline, a 5.03% in the past 24 hours, positions Celestia at the 34th rank with a market cap of $2.5 billion.
If the bearish pressure persists and breaks the intra-day low of $15.60, TIA’s next support level could be around $15.40. However, if Celestia can regain momentum and break above the resistance level of $16.00, it may see a bullish come back toward its previous high of $20.
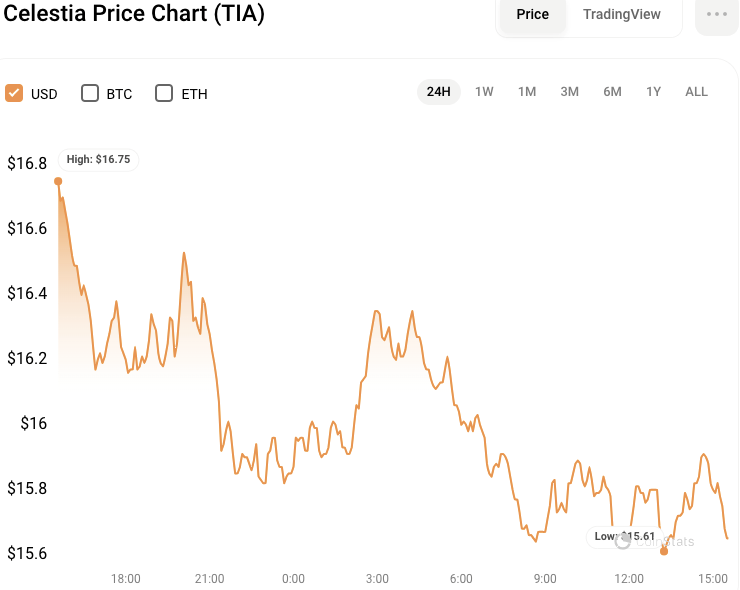
TIA/USD 24-hour price chart (source: CoinStats)
Recent Performance and Market Response
Celestia’s performance, notably influenced by the anticipated TIA staking airdrop, initially saw a dramatic surge. Analysts are observing the situation closely, considering the potential for a rebound, with predictions hinting at a rise to $30. However, current technical analysis presents a more nuanced view.
The Moving Average Convergence Divergence (MACD) shows a bullish crossover, suggesting potential upward momentum. Conversely, the Aroon indicator further supports this uptrend, with the Aroon Up line dominating recent trading sessions.
Significantly, the Money Flow Index (MFI) stands at 56.12, indicating a balanced market. This level steers clear of the extreme conditions often associated with volatile price swings. Consequently, this suggests a trend towards more sustainable growth for Celestia rather than mere speculative spikes.
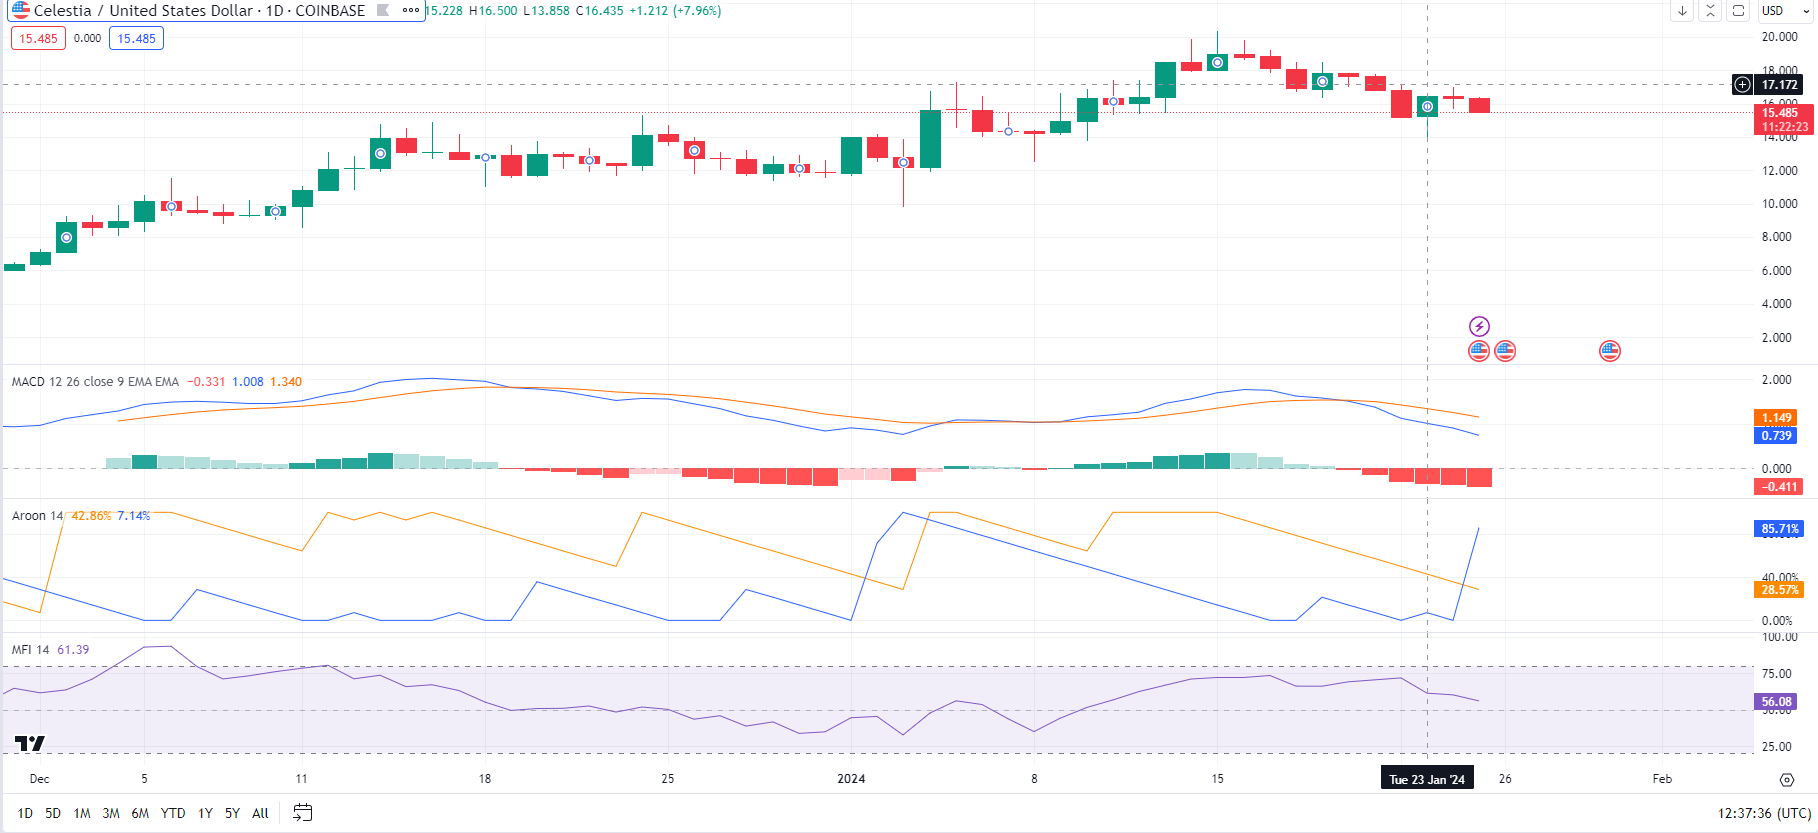
TIA/USD 24-hour price chart (source: TradingView)
This interpretation is bolstered by Celestia’s trading patterns, which demonstrate investor confidence and a perception of the token as a stable investment option amidst broader market instability.
Moreover, Celestia’s calm trading pattern contrasts with the recent intense fluctuations in many other stocks. This steadiness is attracting investors seeking reliable performance in uncertain times. Additionally, the technical indicators reinforce the sentiment that current price levels of TIA are not fleeting highs but rather reflective of the token’s fundamental strength.
Disclaimer: The information presented in this article is for informational and educational purposes only. The article does not constitute financial advice or advice of any kind. Coin Edition is not responsible for any losses incurred as a result of the utilization of content, products, or services mentioned. Readers are advised to exercise caution before taking any action related to the company.


