
- Ever since mid-May, LTC has been trading above the $90 psychological level.
- If the altcoin is able to stay above $91.50, it could clear the past for LTC to reach $100.
- On the other hand, if LTC is unable to stay above $90.51, the altcoin will likely once again fall below $90.
In April, Litecoin’s (LTC) attempt at a recovery was stopped in its tracks after Bitcoin (BTC) got rejected at the crucial $30k level. As a result, LTC’s price dropped back below the $90 psychological level. Since then, LTC has not been able to climb above this level again.
However, CoinMarketCap indicated that LTC was able to finally do so on 16 May 2023, and the altcoin has been trading above $90 since then. Furthermore, LTC was trading hands at $91.31 after a 1.94% price drop over the past 24 hours.
As a result of the recent price drop, LTC weakened against the two market leaders, Bitcoin (BTC) and Ethereum (ETH) by about 1.28% and 1.84% respectively in the past day. Nonetheless, LTC’s weekly performance was able to remain in the green at +4.32%.
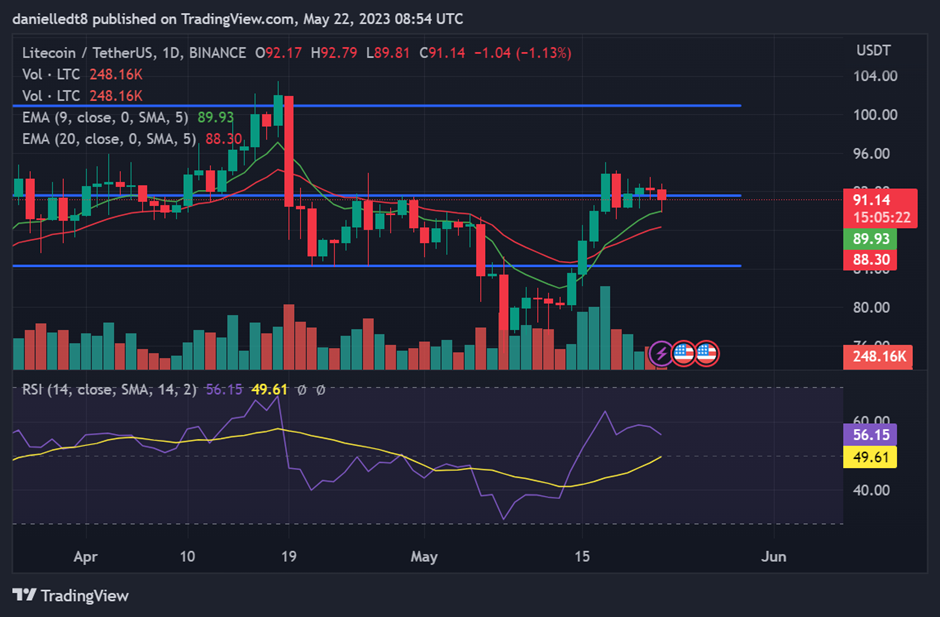
LTC’s price was hovering around the key support level at $91.50 at press time. Should the altcoin close today’s trading session below this level, it could result in a drop to the 20-day EMA line at $88 in the next 24-48 hours. A break below this level will result in LTC dropping further to $84.30.
On the other hand, LTC closing today’s candle above $91.50 will clear a path for it to rise to $100 in the next few days. One technical indicator on the crypto’s daily chart suggested, however, that LTC’s price would close below the key support level at the end of today.
At press time, the daily RSI line on LTC’s chart was sloped bearishly towards the oversold territory. Nevertheless, the daily RSI line was still bullishly trading above the daily RSI SMA line. In addition to this, the 9-day EMA and 20-day EMA lines were acting as support for the altcoin’s price, and the 9-day EMA was bullishly trading above the 20-day EMA line.
Disclaimer: The views and opinions, as well as all the information shared in this price analysis, are published in good faith. Readers must do their own research and due diligence. Any action taken by the reader is strictly at their own risk. Coin Edition and its affiliates will not be held liable for any direct or indirect damage or loss.
Disclaimer: The information presented in this article is for informational and educational purposes only. The article does not constitute financial advice or advice of any kind. Coin Edition is not responsible for any losses incurred as a result of the utilization of content, products, or services mentioned. Readers are advised to exercise caution before taking any action related to the company.


