


- Kava price analysis shows a bearish at the moment, with a 0.23% decrease.
- The bears have taken the lead as KAVA dropped from $0.761 to $0.7468 over 24 hours.
- Support for KAVA/USD is at $0.7286, which is a crucial level to watch.
The Kava price analysis is dictating a sudden decrease in price after an already rising bearish trend. The bearish momentum that is increasing is likely to be seen in the near future, as the bulls remain sluggish at this point. The bulls were currently in control of the market a few hours before the price drop in today’s trading.
If the bears keep up their momentum, then KAVA/USD can possibly go down to $0.7286 in the near future. However, also if the bull can put up enough pressure KAVA/USD can possibly go up to $0.761 in the near term.
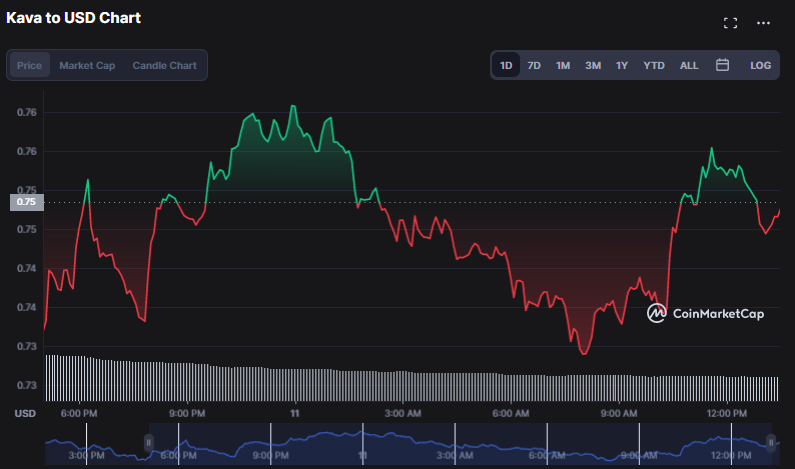
The KAVA token is down by 0.23% and currently trading at $0.7468, as of the time of writing. The 24 trading volume is also on the decrease at the moment, and it is currently at $19 million. Although the market cap is still at a high of $ 280 billion, suggesting that the bulls might come back in the near future.
The bulls and bears are struggling to take control of the market, and it is difficult to predict which way the market will move. But currently, the bearish momentum is more dominant, and it is likely that KAVA/USD will go down to $0.7286 in the near future.
The Moving Average (MA) value is going $0.504, which is still above the SMA 50 curve. This is giving hope to the buyers, although the volatility is decreasing, which is giving an opposite signal as per Kava’s price analysis.
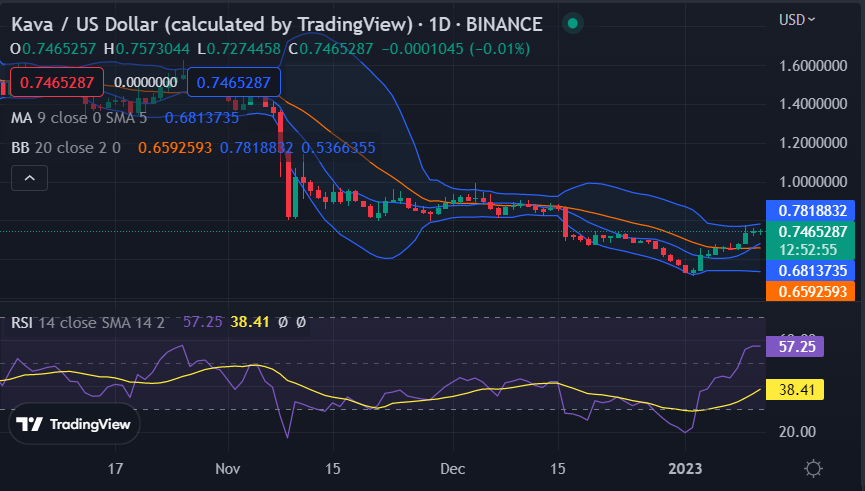
KAVA/USD daily chart: TradingViewThe Bollinger bands are converging with the upper Bollinger band present at $0.781, while the lower Bollinger band is at $0.5366, suggesting that the price will remain range bound in the near future. The Relative Strength Index (RSI) is at the level of 38.41, indicating that KAVA/USD will not reach any extreme levels in the near future.
The 4-hour price chart shows that a small overtake has taken place from the bears, which caused quite a damage in today’s trading session, intensifying the bearish momentum. The momentum has been relatively stronger as the price has dropped drastically; however, support has also appeared as the price has slightly recovered back to $0.7286 during the last few hours. Nevertheless, the trending line is going towards the negative side now.
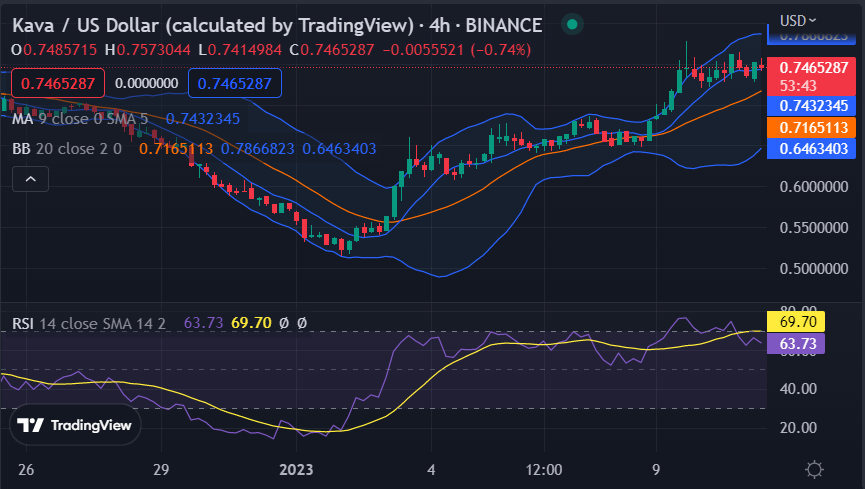
KAVA/USD hourly chart: TradingViewThe hourly Moving average (MA) is currently at the $0.743 level, just near the current market price. The Bollinger bands are narrowing on the chart as the upper band is at $0.786, while the lower band is at $0.6463. The RSI score has also lowered, and after recovering a bit, the indicator is trading at an index of 69.70.
Overall, the KAVA/USD is trading in a sideways pattern, as the buyers and sellers are still struggling to take control of the market. The trend line is going toward the negative side, suggesting that the bears are dominating. The buyers need to gain some strength and push back the price above the $0.735 level.
Disclaimer: The views and opinions, as well as all the information shared in this price prediction, are published in good faith. Readers must do their research and due diligence. Any action taken by the reader is strictly at their own risk. Coin Edition and its affiliates will not be held liable for any direct or indirect damage or loss.
Disclaimer: The information presented in this article is for informational and educational purposes only. The article does not constitute financial advice or advice of any kind. Coin Edition is not responsible for any losses incurred as a result of the utilization of content, products, or services mentioned. Readers are advised to exercise caution before taking any action related to the company.


