


- LDO tops all other DAOs by achieving more than $5.9 Billion TVL.
- Lido’s market has been controlled by bulls which have pushed it up to 1.24.
- Major indicators show that LDO upswing is set to continue.
Data from DefiLlama indicates Lido Dao has surpassed Marker DAO to become the top DAO with a total TVL of 5.9 Billion. The TVL figure for Lido Finance (LDO), the liquidity staking protocol, has surpassed the Marker-established 5.8 billion mark in the last 24 hours. The dApp outperformed most of its rivals thanks to an increase in tokens staked, taking first place.
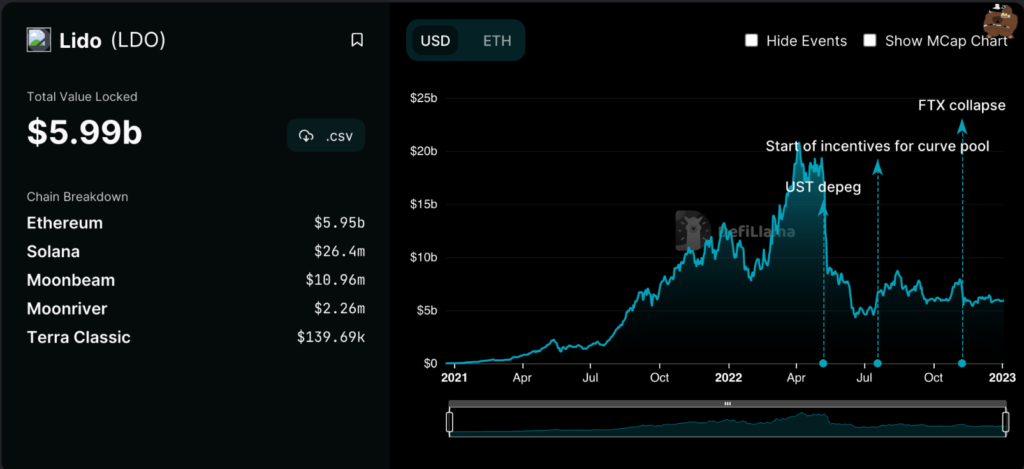
Lido has been on a positive trend from last year as it has topped a couple of times in total value locked. This shows that the DAO has potential for further gains, in the near term as the year begins.
The bulls are currently in charge of the Lido’s market as the price trend has been heading upward for the past two days. Due to the increase in demand, the price of Lido increased to $1.24.
The market cap increased by 15.64% to $1,021,800,691, indicating considerable purchasing activity, and the 24-hour trading volume increased by 37.78% to $93,404,744.
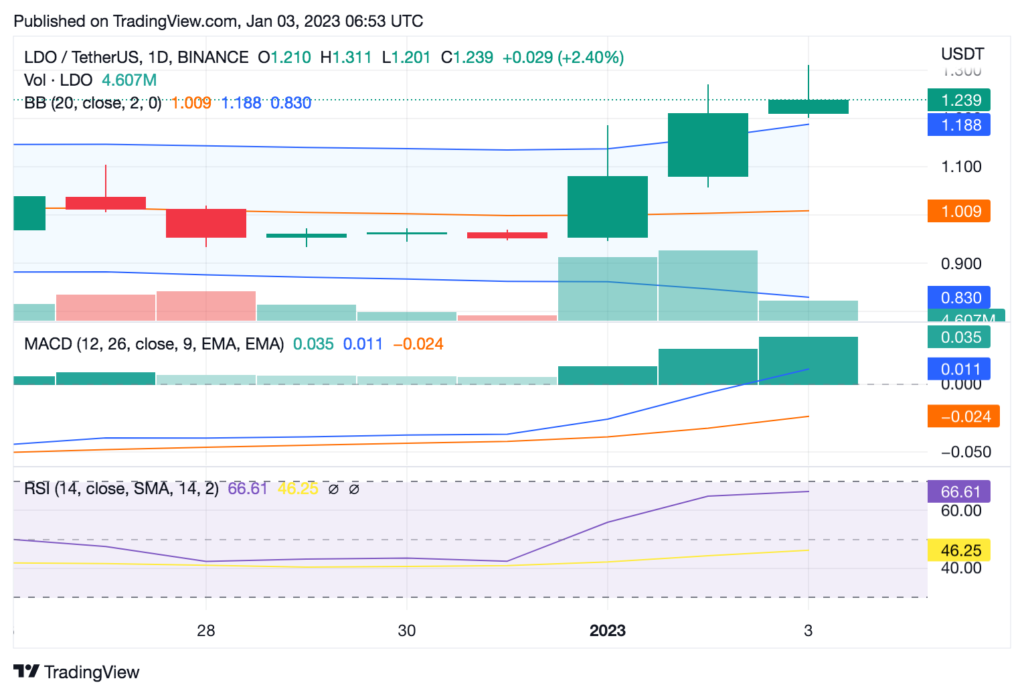
With a reading of -0.024, the Moving Average Convergence Divergence (MACD) is moving upward and in the positive territory. Additionally, the blue MACD line crossing above the signal line indicates that Lido is likely to continue moving in the right direction.
The bulging Bollinger Bands imply increased purchasing activity. The market is rising above both zones, a sign that bulls are becoming more powerful and adding to the current positive market sentiment. With the top band at $1.187 and the bottom band at $0,829, a potential bullish trend can be spotted.
On the daily chart, LDO trades above the 100 SMA, indicating that the positive trend will continue. Additionally, the price of the currency is above its 200 SMA, suggesting that investors are still optimistic about future gains in the near future. At 66.61, the Relative Strength Index (RSI) indicates that LDO is approaching the overbought level.
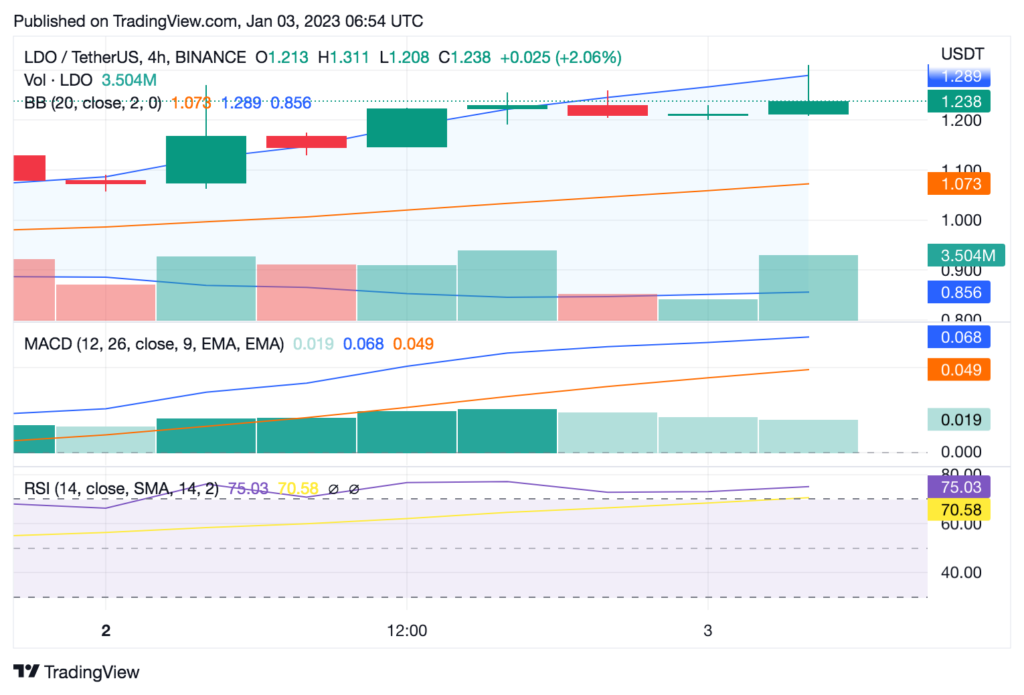
On the 4 hour chartLDO has entered the overbought level indicating that the buyers have been in control of LDO’s market thus increasing selling pressure.Major technical indicators point to further rise in the near future, and it is anticipated that the market will remain generally positive.
Disclaimer: The views and opinions, as well as all the information shared in this price analysis, are published in good faith. Readers must do their own research and due diligence. Any action taken by the reader is strictly at their own risk, Coin Edition and its affiliates will not be held liable for any direct or indirect damage or loss
Disclaimer: The information presented in this article is for informational and educational purposes only. The article does not constitute financial advice or advice of any kind. Coin Edition is not responsible for any losses incurred as a result of the utilization of content, products, or services mentioned. Readers are advised to exercise caution before taking any action related to the company.
 Price Prediction: Can BTW Sustain Its Breakout Above $0.1032?")


