


- LINK traded in the red zone during the past week, but bulls hold the bears from running rampant.
- Bulls lose momentum halfway through the regression trend channel.
- LINK is in the oversold region; the market could correct the prices.
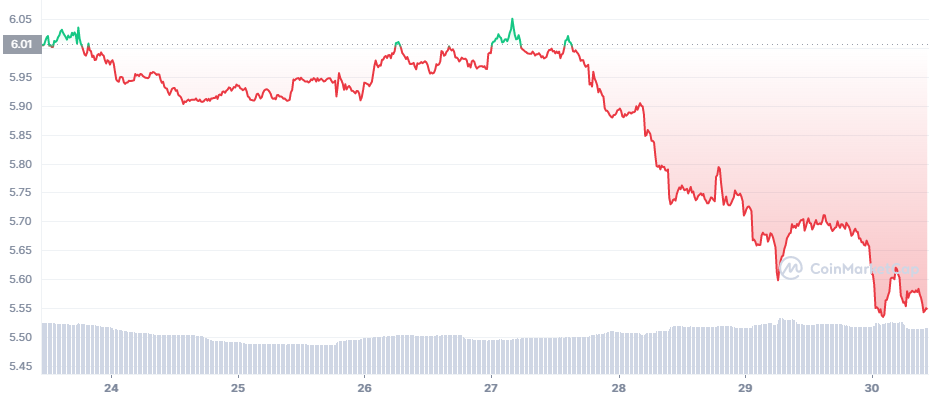
Chainlink (LINK) opened the market for the week with its prices at $6.01, as shown in the chart below. The token was able to sell above its opening market price (green zone) for just a few hours before the bears plunged LINK into the red zone.
Although the bears were able to pull the prices into the red zone, the bulls did not let the bears run rampant. Hence, LINK fluctuated within a tight range of $5.90- $6.00 for the first five days of the past week. During this period, LINK hit the green zone for a brief period and recorded its highest price of $6.05 for the week.
However, come the sixth day of the week, the bulls weren’t able to keep LINK from taking a deep dive in prices. After registering its highest price, LINK started its descent and recorded its lowest of $5.53 on its way down. Currently, LINK is down by 2.64% in the last 24 hours and is trading at $5.55.
According to the regression trend indicator shown in the chart below, LINK fluctuated between the median and upper line during the first half of the regression trend. But later on, towards the latter part of the indicator, LINK moved more towards the median as the bulls lost momentum. Once LINK broke the regression trend, it started its descent.
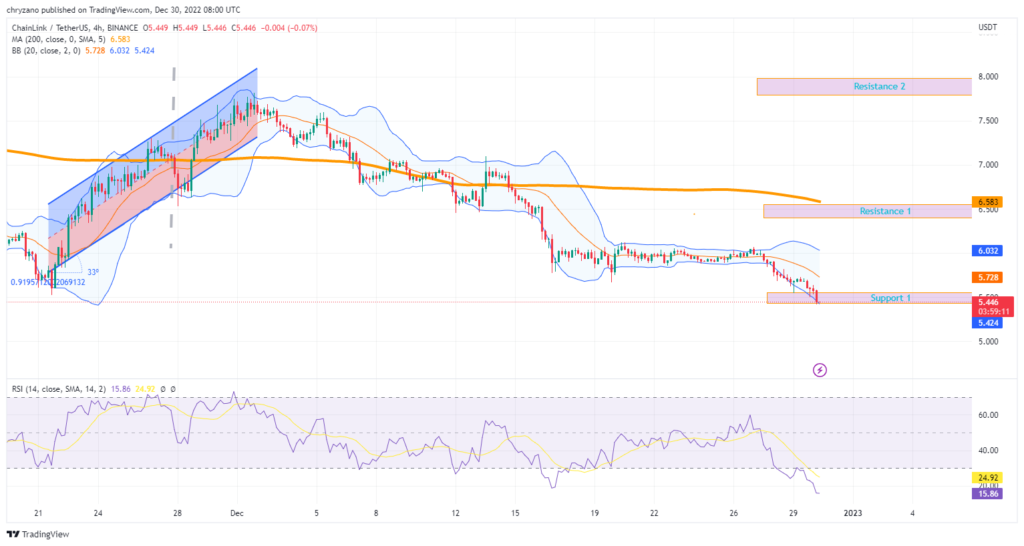
On December 2, LINK started crashing and continued its downward trend till December 19. However, the descent wasn’t easy for the bears as the bulls chipped in every now and then for LINK’s rescue.
Right after moving from the bear flag, LINK started moving sideways. Currently, LINK is on a downtrend, very close to Support 1 (≈$5.5). Since LINK has touched the lower Bollinger band, the market could correct the price of LINK.
Additionally, the Relative Strength Index is 16.00 and is considered oversold. However, if LINK rises, the bulls will need to exert pressure to hit resistance 1(≈$6.5), which also overlaps with the 200-day MA. However, if the bears take over, LINK will fall to unprecedented levels.
Disclaimer: The views and opinions, as well as all the information, shared in this price analysis, are published in good faith. Readers must do their own research and due diligence. Any action taken by the reader is strictly at their own risk, Coin Edition and its affiliates will not be held liable for any direct or indirect damage or loss.
Disclaimer: The information presented in this article is for informational and educational purposes only. The article does not constitute financial advice or advice of any kind. Coin Edition is not responsible for any losses incurred as a result of the utilization of content, products, or services mentioned. Readers are advised to exercise caution before taking any action related to the company.


