


- The price of Chainlink (LINK) surged more than 4% over the past 24 hours.
- Throughout the last day of trading, LINK’s price printed a second higher low.
- Meanwhile, a significant medium-term bullish flag was on the verge of being triggered on LINK’s daily chart.
The price of Chainlink (LINK) surged more than 4% over the past 24 hours, according to CoinMarketCap. As a result, the cryptocurrency was changing hands at $6.98. Notably, the altcoin’s weekly performance also stood at more than +10%. At press time, technical indicators on LINK’s chart suggested that this positive momentum may continue in the coming days.
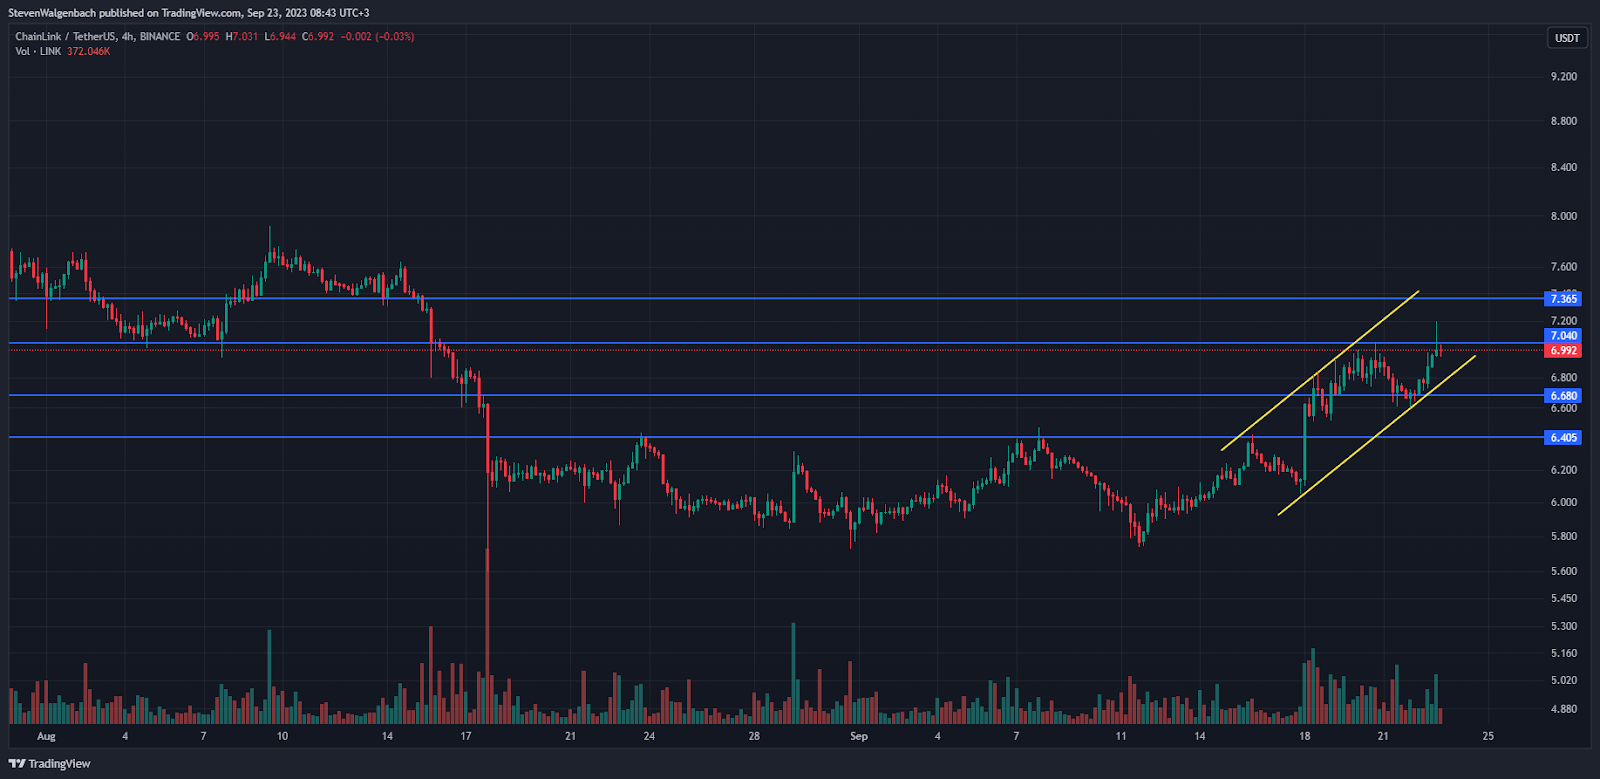
Over the past 24 hours, LINK’s price rebounded off of the key support level at $6.680. This resulted in the altcoin’s price printing a second higher low for the week – leading to the formation of a positive trend line. During this same period, LINK also printed numerous higher highs. Subsequently, a positive price channel formed on LINK’s 4-hour chart as well.
After rebounding from the $6.680 mark, LINK’s price entered into a positive move and was able to break above the next resistance level at $7.040 to reach a high of $7.195 earlier today. Since then, the cryptocurrency’s price has pulled back to trade back below this threshold at press time.
Nevertheless, the bullish trend continuing in the next 24-48 hours may lead to LINK flipping the resistance level into support. Thereafter, the cryptocurrency’s price could have the foundation needed to rise to $7.365 as well.
On the other hand, LINK’s price breaking below the positive trend line that had formed on its chart may put it at risk of retesting the aforementioned support level at $6.680. If this support fails to hold, then sellers will have little in the way stopping them from dragging LINK’s price down to $6.405.

Looking at the daily chart for LINK/USDT, a noteworthy bullish technical flag was on the verge of being triggered. At press time, the 20-day EMA line was attempting to cross above the 50-day EMA line. Should these 2 technical indicators cross, it will suggest that medium-term momentum has shifted in favor of buyers, which may lead to LINK’s price rising.
Notably, short-term momentum for LINK was positive, as the 9-day EMA line was positioned above the 20-day EMA line at press time. This indicated that LINK’s momentum had been more bullish throughout the past 9 days than its momentum over the past 20 days.
Furthermore, the shorter EMA line breaking away from the 20-day EMA line suggested that this bullishness was growing stronger. Subsequently, LINK may close today’s daily candle above $7.040.
Disclaimer: The views and opinions, as well as all the information shared in this price analysis, are published in good faith. Readers must do their own research and due diligence. Any action taken by the reader is strictly at their own risk. Coin Edition and its affiliates will not be held liable for any direct or indirect damage or loss.
Disclaimer: The information presented in this article is for informational and educational purposes only. The article does not constitute financial advice or advice of any kind. Coin Edition is not responsible for any losses incurred as a result of the utilization of content, products, or services mentioned. Readers are advised to exercise caution before taking any action related to the company.
: What Happens If You Use an Unlicensed Platform?")


