


- LQTY shows bullish momentum with the potential for further price gains.
- Traders should watch for resistance levels and market sentiment shifts.
- Coppock Curve suggests a potential for a correction in the near future.
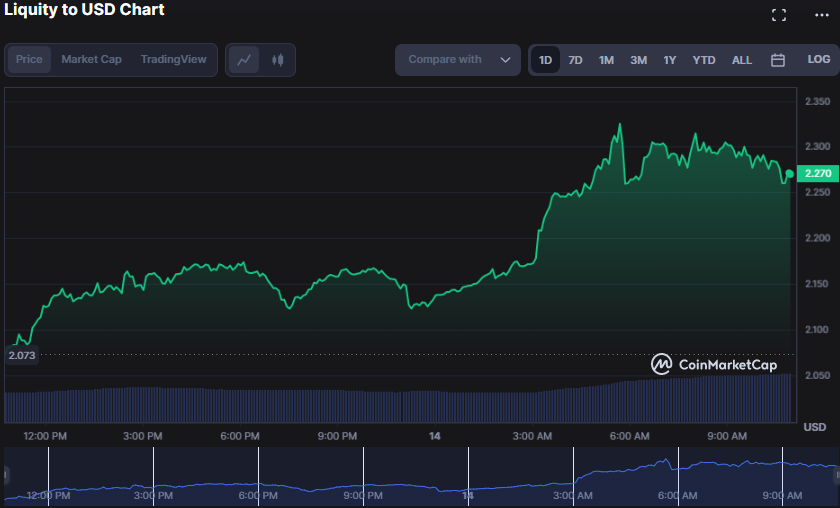
Liquity (LQTY) has seen substantial bullish momentum in the previous 24 hours, with the token’s price increasing by over 10% to $2.26 at the time of writing. During the uptrend, $2.08 and $2.33 have served as support and resistance for LQTY, respectively.
During the upturn, the market capitalization and 24-hour trading volume of LQTY increased by 8.56% and 63.03%, respectively, to $207,838,282 and $63,924,929. This may indicate that the market has a favourable view of LQTY due to the sharp uptick in demand and interest from investors.
If the rally continues and $2.33 is broken, it might lead to further positive momentum and even higher price objectives for LQTY. The next resistance level to monitor would be around $2.50, which might be a crucial psychological milestone for traders and investors. However, if the bulls fail to break through that level, we may see a pullback toward the support level at $2.00.
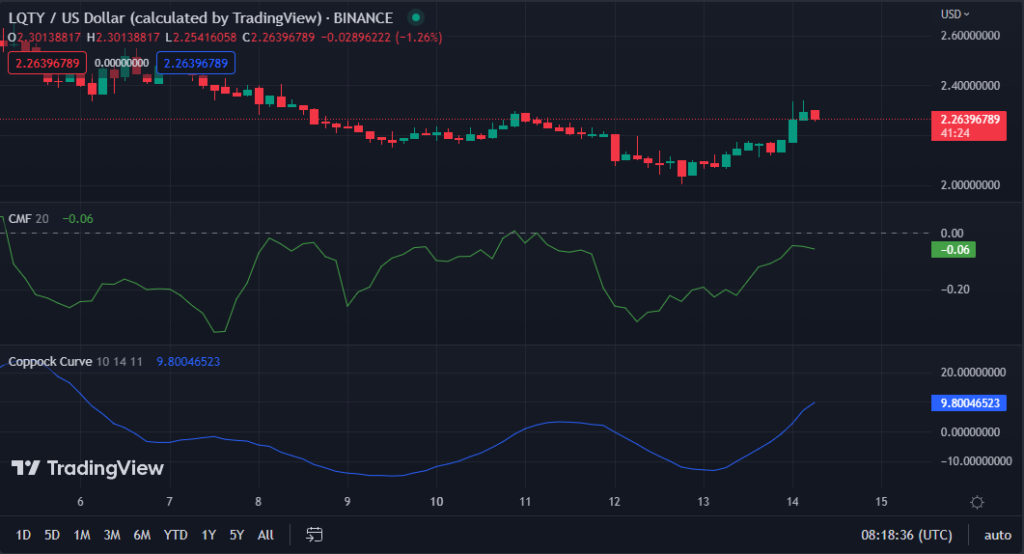
Despite being positive, the Chaikin Money Flow (CMF) reading of -0.05 on the LQTYUSD 3-hour price chart indicates that there is still some selling pressure in the market. However, this might imply a possible buying opportunity for traders trying to join the market at a lower price. This action urges investors to “wait and watch” the market before making any investment choices since future price changes may occur.
The Coppock Curve reading of 9.89361518 indicates that the bullishness in LQTY may not last long and that a correction may occur in the near future.
This is because the Coppock Curve helps predict market trend reversals, and a score over zero implies a positive trend; however, a high number like 9.89361518 might signal that the asset is overbought and ready for correction.
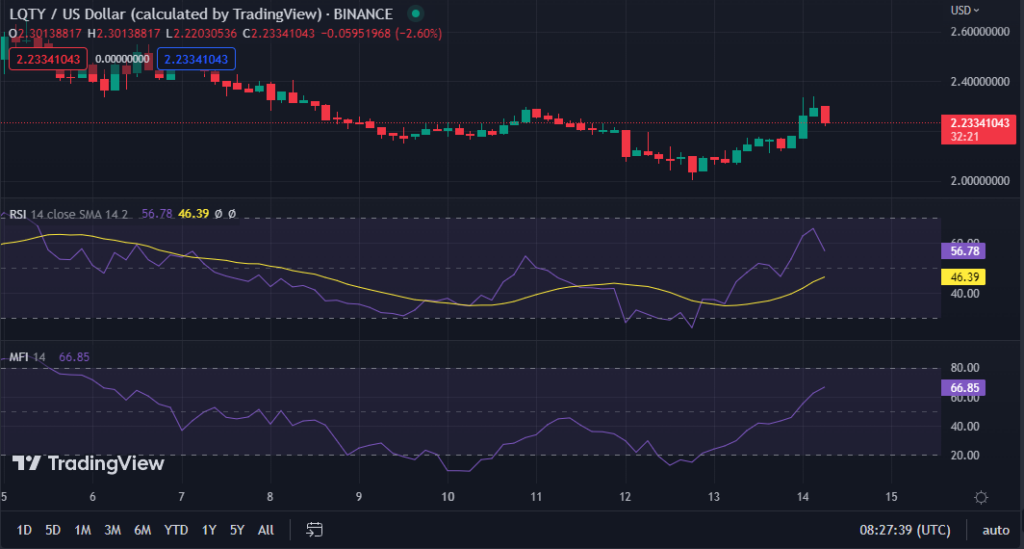
The Money Flow Index rating of 68.48 on the LQTY suggests that purchasing pressure is now greater than selling pressure, indicating a likely positive trend in the near future.
This move shows that the current bullish momentum may continue for some time, but traders should watch for any notable changes in trading volume or market mood that might indicate a shift in the trend.
With a Relative Strength Index of 59.56, current market circumstances imply modest buying pressure, which might increase the price. However, its downward movement suggests that traders who have held the asset for a time may be taking profits, resulting in a short drop in price before it restarts its upward trend.
Liquity’s recent bullish momentum may continue if it breaks through resistance levels, but caution is advised as indicators suggest a possible correction.
Disclaimer: The views, opinions, and information shared in this price prediction are published in good faith. Readers must do their research and due diligence. Any action taken by the reader is strictly at their own risk. Coin Edition and its affiliates will not be liable for direct or indirect damage or loss.
Disclaimer: The information presented in this article is for informational and educational purposes only. The article does not constitute financial advice or advice of any kind. Coin Edition is not responsible for any losses incurred as a result of the utilization of content, products, or services mentioned. Readers are advised to exercise caution before taking any action related to the company.


