


- LUNC drops 6.78% post-rejection of 800M USTC burn, sparking investor interest.
- USTC declines 5% amidst community division, indicating market uncertainty.
- Increased LUNC trading volume hints at potential price rebound following proposal veto.
The price of Terra Luna Classic (LUNC) has retraced in the last 24 hours following the community’s decision to reject a burn proposal of 800 million USTC. This decision, marked by a lack of consensus among members and validators, has sent ripples through the cryptocurrency market.
Community Divided Over Burn Proposal
The proposal, numbered 11927 and titled “Burn of 800m USTC Funds,” was on the brink of rejection by the Terra Luna Classic community. With the voting deadline set for December 27, the initiative aimed to burn a significant amount of USTC in the Risk Harbor multisig wallet. This action was deemed crucial following the notification that Risk Harbor lost the keys, rendering recovery of funds impossible.
Despite the urgency, the proposal garnered only 30% support in favor, with 11% opposing and 15% opting for a veto. A significant 44% of the votes were abstentions. The split in the community’s opinion highlights the complexity of decision-making on decentralized finance platforms.
Impact on LUNC and USTC Prices
Consequently, the Terra Luna Classic’s token price has been affected. LUNC saw a 6.78% decline over the past day, trading at $0.0001455. The token experienced fluctuations, with the 24-hour trading range spanning from $0.0001425 to $0.0001571, according to CoinMarketCap.
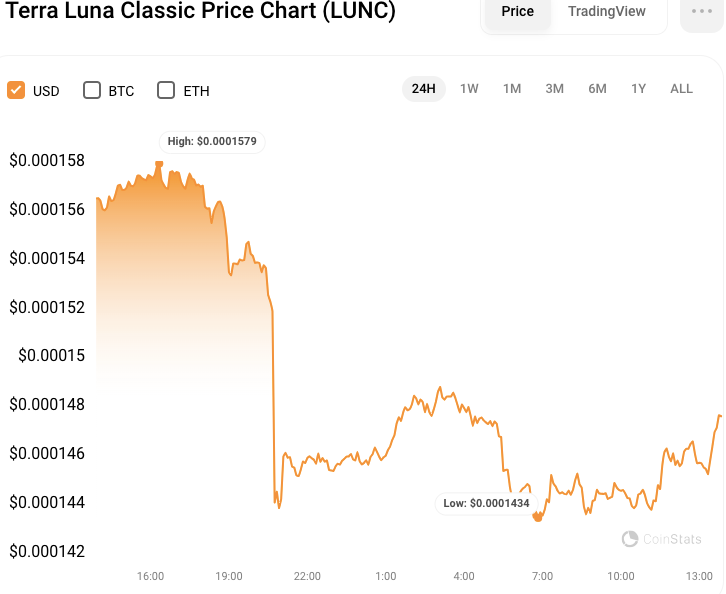
During the dip, LUNC’s market capitalization plummeted 5.92% to $860.37 million, while 24-hour trading volume increased 11% to $77.14 million. Despite the price fall, this increase in trading volume shows increasing activity and interest in LUNC, with investors potentially taking advantage of the reduced prices to purchase additional tokens.
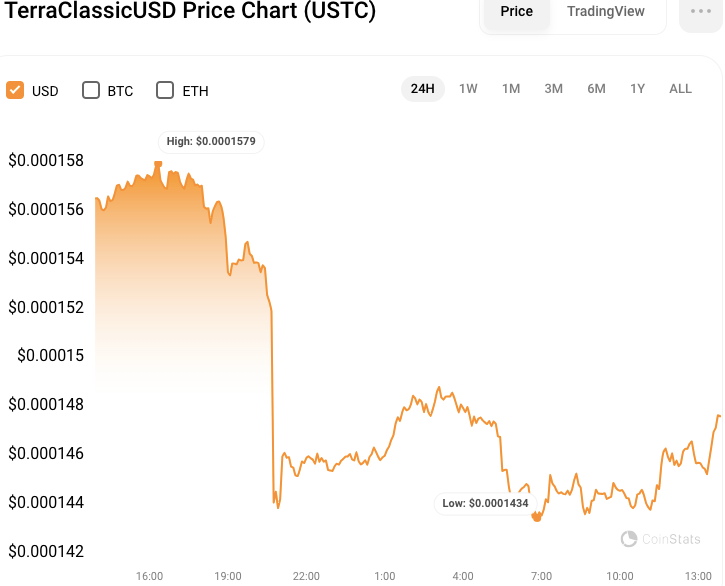
Similarly, USTC’s value witnessed a 5% decrease, with the current price at $0.03314. The price movement mainly remained flat over the week, indicating market uncertainty. The 24-hour trading range for USTC was between $0.032 and $0.0352.
LUNC/USD Technical Analysis
The Moving Average Convergence Divergence (MACD) on the 4-hour price chart is moving in the negative region with a rating of -0.000003747, indicating that the bearish momentum for USTC may continue in the short term. On the other hand, the lower bars on the MACD histogram suggest a drop in selling pressure, which could lead to price stabilization soon. If the histogram turns positive, it could indicate a reversal of the bearish trend and increased purchasing pressure.
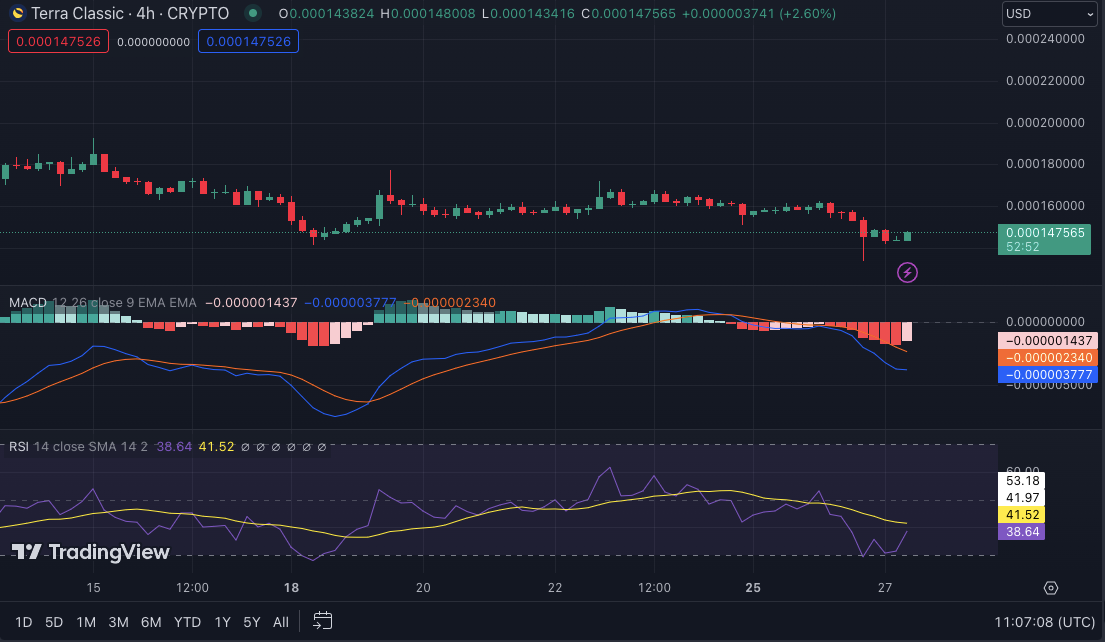
The Relative Strength Index (RSI) of 39.17 and the rising trend after being in the oversold range suggest that there may be a minor rise in LUNC purchasing activity. Furthermore, the higher trading volume for LUNC shows an increase in investor interest. If the RSI rating rises further and trading volume remains high, it could suggest a greater positive attitude and lead to further price gains for LUNC.
Disclaimer: The information presented in this article is for informational and educational purposes only. The article does not constitute financial advice or advice of any kind. Coin Edition is not responsible for any losses incurred as a result of the utilization of content, products, or services mentioned. Readers are advised to exercise caution before taking any action related to the company.


