
- LUNC price shows bullish signs amid increasing trading volume.
- Moving averages suggest potential bullish momentum for LUNC.
- Rising Bollinger Bands indicate higher volatility and a possible price breakout for LUNC.
The Terra Classic (LUNC) market opened at $0.00009893 and surged to a high of $0.0001028 as the day progressed, thanks to an early bullish surge. However, bullish momentum faltered after facing resistance at $0.0001028.
As a result, the bears took control of the market and drove the price to a 24-hour low of $0.00009592 (support level). As of press time, bearish dominance was still in play, as seen by the 1.81% drop to $0.00009781.
LUNC’s market capitalization dipped by 2.47% to $572,505,483, while the 24-hour trading volume soared by 23.10% to $113,913,690. This increase in trading volume indicates that traders are buying and selling LUNC due to the recent decline in the hope of a bullish recovery.
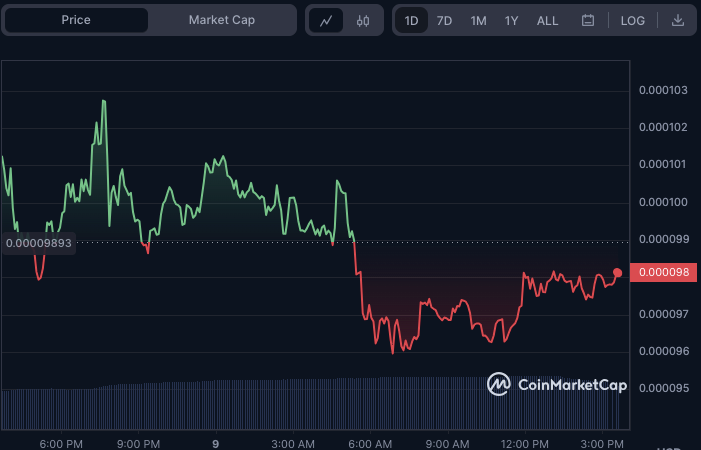
LUNC/USD 24-hour price chart (source: CoinMarketCap)
The 10-day moving average (blue) is advancing above the 50-day moving average (yellow) on the LUNC 4-hour price chart, with the former and latter at $0.00009903 and $0.00009368, respectively.
This crossing indicates that the shorter-term average is increasing faster than the longer-term average, suggesting a possible move in mood toward bullishness. Since the moving averages are trending higher, it may be a good buying opportunity since the market is strengthening.
Adding to this bullish anticipation, the price action motion is above the long-term moving average and developing a green candlestick suggesting that the bullish trend is gaining momentum.
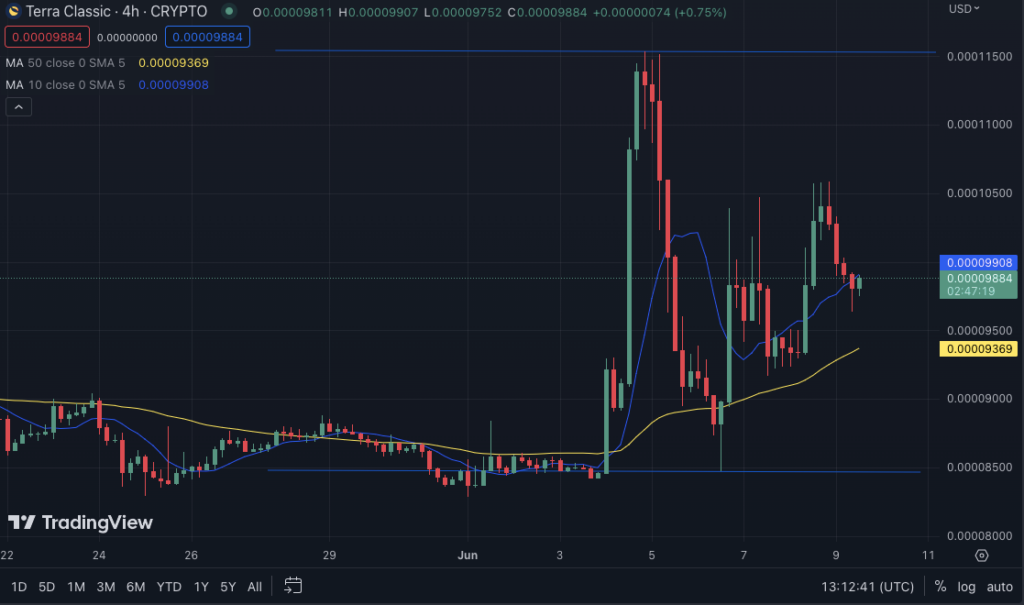
LUNC/USD 4-hour price chart (source: TradingView)
Bollinger Bands on the LUNC price chart are rising linearly, with the upper and lower bands approaching $0.00010511, indicating that the LUNC token is seeing higher volatility.
The bullish candlesticks above the middle band indicate buyers are gaining market control and increasing prices. If the price movement breaks through the upper band, it might imply a possible breakout and additional price growth.
The Bull Bear Power indicator rating in the LUNC market is negative, with a -0.00000021 level indicating bearishness. However, its rising trend and near closeness to the “0” line signal market sentiment is shifting toward bullishness.
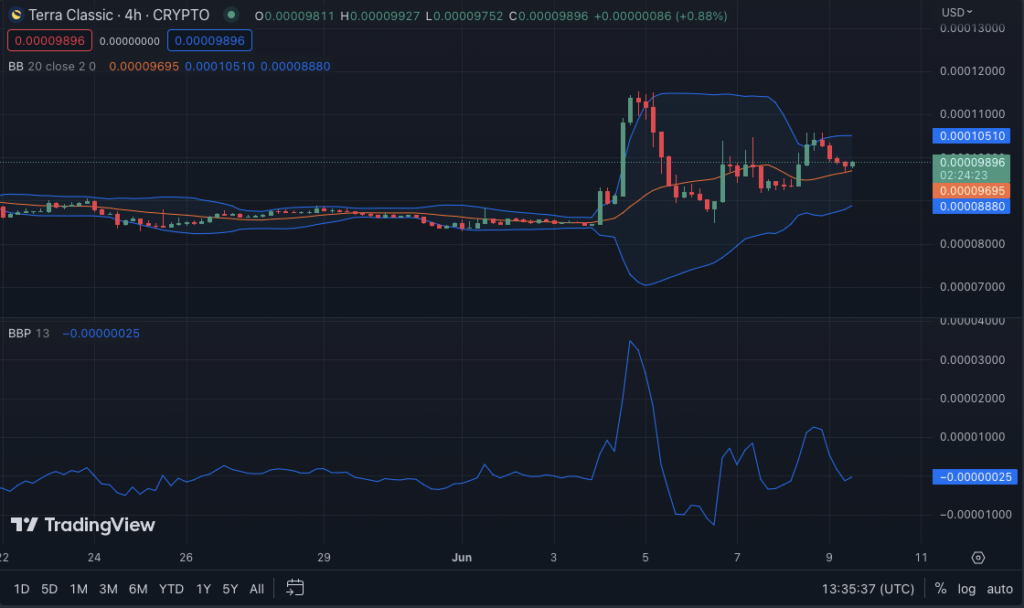
LUNC/USD 4-hour price chart (source: TradingView)
In conclusion, LUNC shows signs of a potential bullish reversal, with rising moving averages and increasing trading volume indicating a possible price surge.
Disclaimer: The views, opinions, and information shared in this price prediction are published in good faith. Readers must do their research and due diligence. Any action taken by the reader is strictly at their own risk. Coin Edition and its affiliates will not be liable for direct or indirect damage or loss.
Disclaimer: The information presented in this article is for informational and educational purposes only. The article does not constitute financial advice or advice of any kind. Coin Edition is not responsible for any losses incurred as a result of the utilization of content, products, or services mentioned. Readers are advised to exercise caution before taking any action related to the company.


 Price Prediction: UNI Eyes $5 as UNI Extends Bullish Breakout")

