


- The Terra Classic (LUNC) price has skyrocketed 83% over the past month.
- LUNC was able to break above the key resistance level at $0.00011695 and continued to trade above this level at press time.
- Technical indicators suggested that LUNC may attempt to break above $0.00014915 before rising to as high as $0.0002.
Terra Classic (LUNC) has experienced a meteoric rise over the past month. CoinMarketCap data indicated that the cryptocurrency’s value has risen a remarkable 83% in the last 30 days. The bulk of this surge was recorded during the last 7 days, a period which saw LUNC’s value climb more than 61%. At press time, technical indicators suggested it could continue rising.
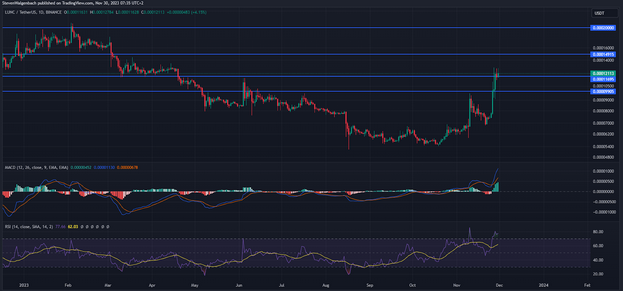
LUNC was able to break above the $0.00011695 resistance level in the last couple of days and continued to trade above this mark at press time. If the altcoin is able to close a daily candle above this significant price point, then LUNC may have the foundation needed to rise to the subsequent barrier.
In this bullish scenario, LUNC may embark on a journey towards $0.00014915. This will be the last major obstacle standing in the way of LUNC reaching the $0.0002 resistance level. Subsequently, a daily candle close above $0.00014915 could likely be followed by the cryptocurrency’s value soaring to $0.0002 within the following 2 weeks.
This bullish thesis may be invalidated if LUNC closes a daily candle below $0.00011695 through the course of the next 72 hours. Investors and traders will want to note that the chances of LUNC’s price temporarily pulling back have risen following LUNC’s 28.57% surge on Sunday and its 18.42% spike on Tuesday.
Given these strong price movements, it may only be a matter of time before traders begin to take profit on their LUNC positions. If the cryptocurrency’s price does correct, it will most likely test the key support level at $0.00009905.
Despite the looming threat of a price drop, technical indicators on LUNC’s daily chart suggested that its bullish momentum has not subsided yet. Both the Moving Average Convergence Divergence (MACD) and Relative Strength Index (RSI) indicators were flagging bullish.
The MACD line was breaking away above the MACD Signal line. This could be indicative of LUNC’s positive momentum continuing. Meanwhile, the RSI line was positioned bullishly above the RSI Simple Moving Average (SMA) line, which could indicate that buyers had the upper hand.
Disclaimer: The information presented in this article is for informational and educational purposes only. The article does not constitute financial advice or advice of any kind. Coin Edition is not responsible for any losses incurred as a result of the utilization of content, products, or services mentioned. Readers are advised to exercise caution before taking any action related to the company.
 Price Prediction 2026, 2027, 2028, 2029, 2030-2050")


