


- Bullish momentum strengthens as LUNC resists bearish pressure.
- Increased interest drives LUNC’s market cap and trading volume.
- Positive indicators suggest a potential surge towards $0.0001100.
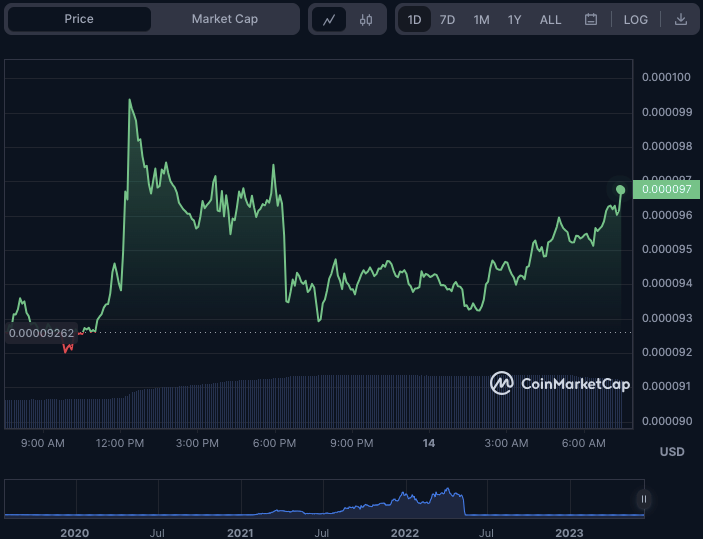
Bearish attempts to lower the Terra Classic (LUNC) price in the previous 24 hours failed after support was established at the intraday low of $0.00009202. Due to the bullish counter, the price of LUNC surged to a 24-hour high of $0.0001002 before encountering hefty resistance.
However, the 4.06% surge from the previous close to $0.00009666 as of press time indicates that this hurdle wasn’t holding back bullish momentum.
During the bull run, LUNC’s market capitalization and 24-hour trading volume increased by 4.30% and 74.24%, respectively, to $564,864,022 and $84,917,842. This increase demonstrates increased interest in LUNC as a possible investment prospect. If bullish momentum breaks over the $0.0001002 resistance, LUNC’s next target might be the $0.0001100 mark.
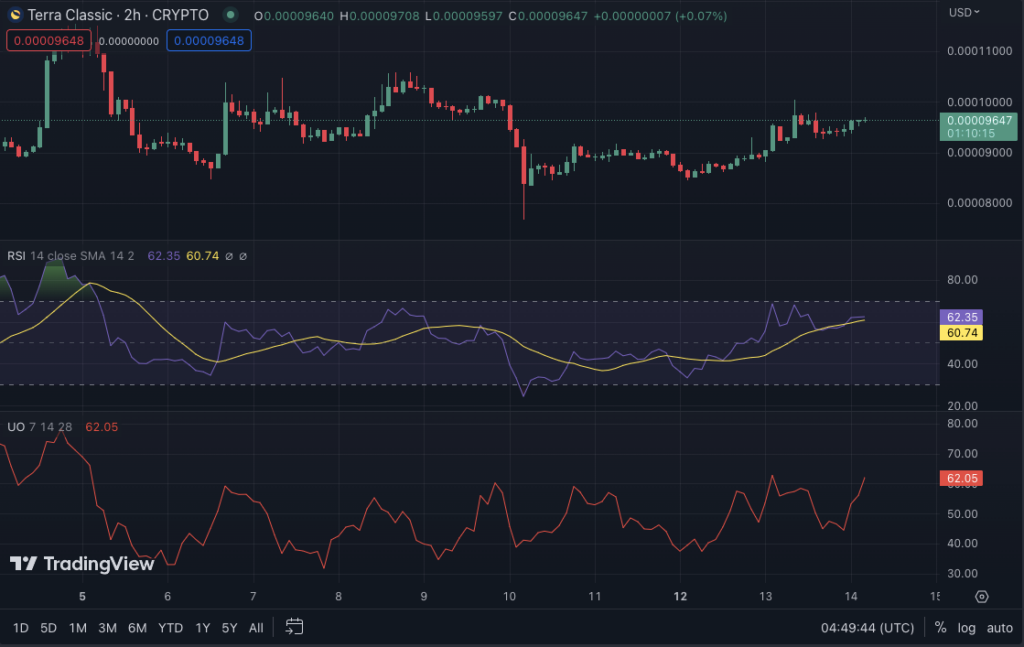
The LUNC/USD price chart’s Relative Strength Index rating of 63.41 indicates that buying pressure is more significant than selling pressure. While buying pressure exceeds selling pressure, the bullish momentum may continue, increasing LUNC/USD’s price.
However, if the RSI rises beyond the overbought threshold of 70, it may suggest that the price has become overpriced and that a correction is coming.
When the Ultimate Oscillator (UO) begins to fall from an overbought position, it may indicate that buying pressure is waning, and a negative trend is on the way. If, on the other hand, the UO climbs from an oversold level, selling pressure is reduced, and a bullish trend develops.
As a result, the rising Ultimate Oscillator, with a rating of 63.39 on the LUNC price chart, shows that the market’s positive trend may continue.
The MACD blue line advances in the positive zone with a value of 0.00000163 above its signal line, adding to the bullish trajectory. This movement indicates that the bullish momentum is building and may last for some time. With the histogram in the positive range, the bullish trend is reinforced.
The stochastic RSI rating of 54.32 also suggests that the LUNC market is now healthy, with neither overbought nor oversold conditions. However, its upward movement signals that bulls are gathering strength and may soon drive the LUNC price higher.
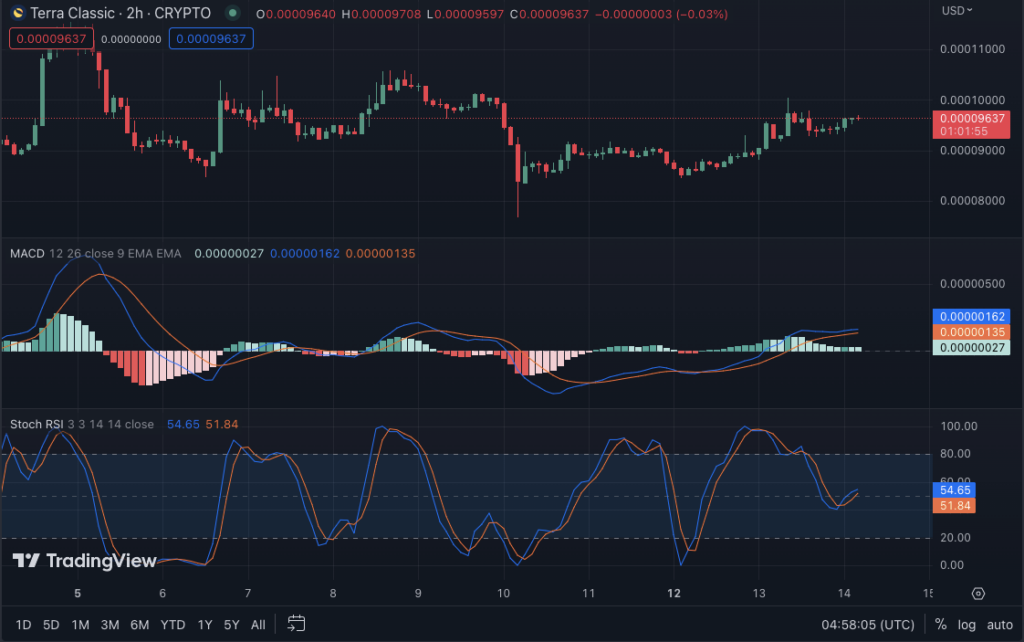
In conclusion, LUNC’s bullish momentum remains strong, with increasing market capitalization, trading volume, and positive technical indicators suggesting potential for further price gains.
Disclaimer: The views, opinions, and information shared in this price prediction are published in good faith. Readers must do their research and due diligence. Any action taken by the reader is strictly at their own risk. Coin Edition and its affiliates will not be liable for direct or indirect damage or loss.
Disclaimer: The information presented in this article is for informational and educational purposes only. The article does not constitute financial advice or advice of any kind. Coin Edition is not responsible for any losses incurred as a result of the utilization of content, products, or services mentioned. Readers are advised to exercise caution before taking any action related to the company.

: What Happens If You Use an Unlicensed Platform?")


