


- Ali Martinez revealed that the TD Sequential on MANA’s weekly chart is presenting a sell signal.
- The analyst shared that the indicator has been a reliable tool for identifying price bottoms.
- MANA was trading hands at $0.4912 at press time after it dropped 2.46%.
The cryptocurrency trader and analyst Ali Martinez revealed in an X post yesterday that the weekly chart for Decentraland (MANA) is presenting a sell signal. In the post, the analyst shared that the TD Sequential on the altcoin’s weekly chart suggests that MANA may be “gearing up for a price correction”.
According to Martinez, the TD Sequential has been a reliable tool for “pinpointing local bottoms” on MANA’s weekly chart since June this year. Over the last 24 hours, the bearishness expressed by the signal seems to have played out. Data from the cryptocurrency market tracking website CoinMarketCap indicated that MANA was down 2.46%.
The altcoin was changing hands at $0.4912 at press time. This was after MANA managed to reach a high of $0.5026 throughout the past day of trading. Since establishing this peak, the cryptocurrency has corrected to trade at its current level. Nevertheless, it was still trading slightly closer to this 24-hour high than its low for the same period, which stood at $0.4798.
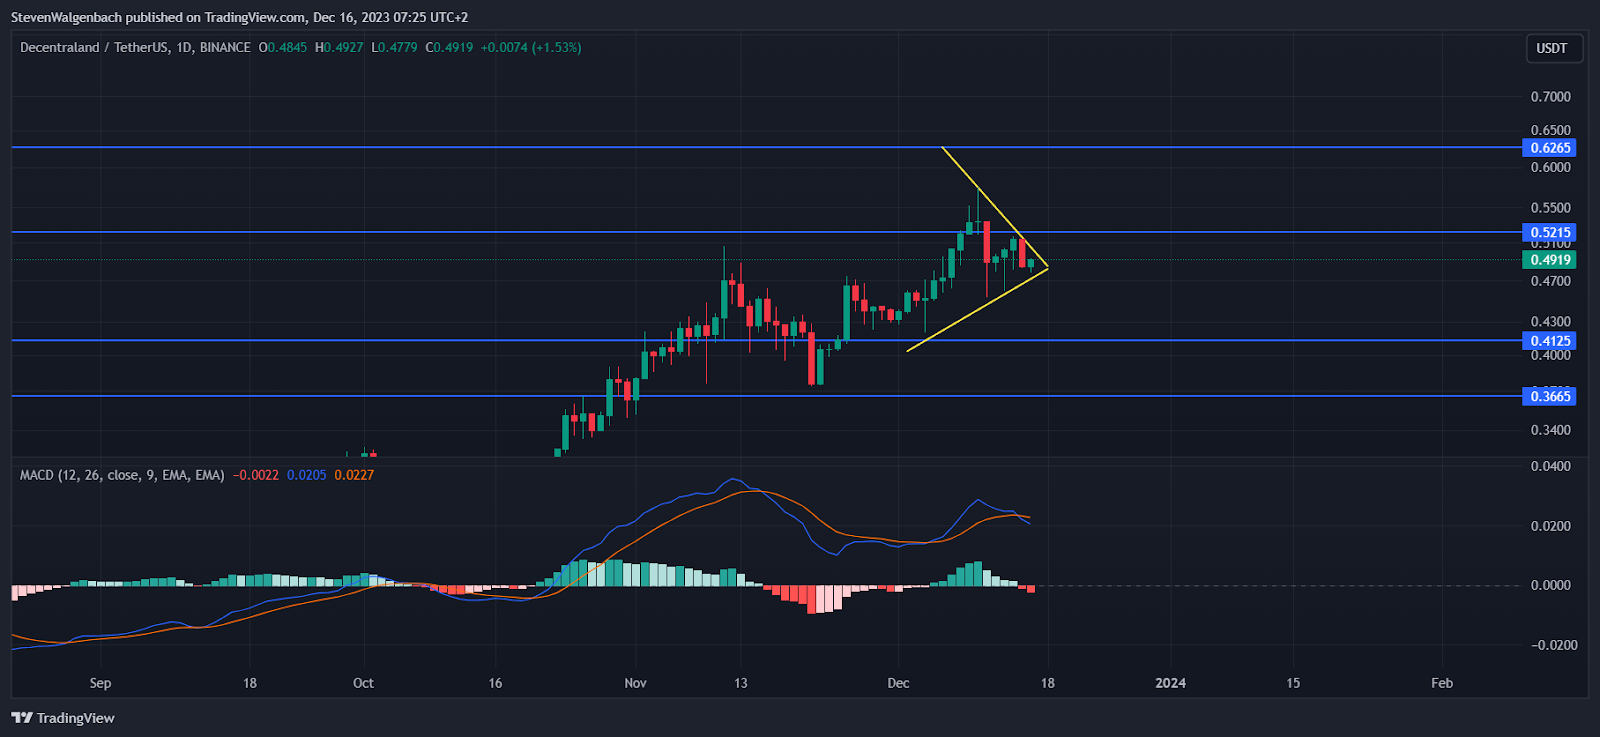
A symmetrical triangle has emerged on MANA’s daily chart, which could be a sign that MANA will break out soon. Should the altcoin’s price enter into a bullish move in the coming few days, it may flip the $0.5215 resistance level into support. A daily candle close above this barrier could then lead to MANA rising to $0.6265.
On the other hand, a bearish breakout may lead to MANA falling to $0.4125 in the following couple of days. Continued sell pressure once MANA drops to this support level could drag it all the way down to $0.3665.
Traders and investors will want to note that a major bearish technical flag was triggered over the past 48 hours. During this period, the Moving Average Convergence Divergence (MACD) line crossed below the MACD Signal line. This may be a sign that MANA’s trend has undergone a bearish reversal.
Disclaimer: The information presented in this article is for informational and educational purposes only. The article does not constitute financial advice or advice of any kind. Coin Edition is not responsible for any losses incurred as a result of the utilization of content, products, or services mentioned. Readers are advised to exercise caution before taking any action related to the company.


