


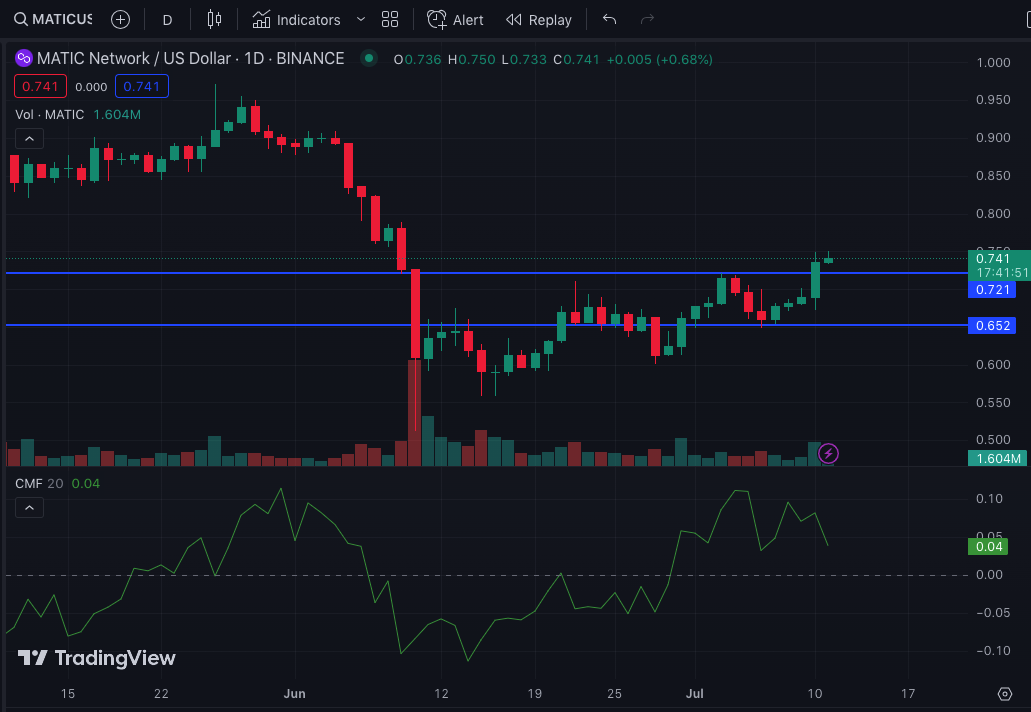
- MATIC flipped the $0.72 resistance, as demand pushed the price to a 30-day high.
- The CMF indicated that more money had flown into MATIC but the momentum could slow down.
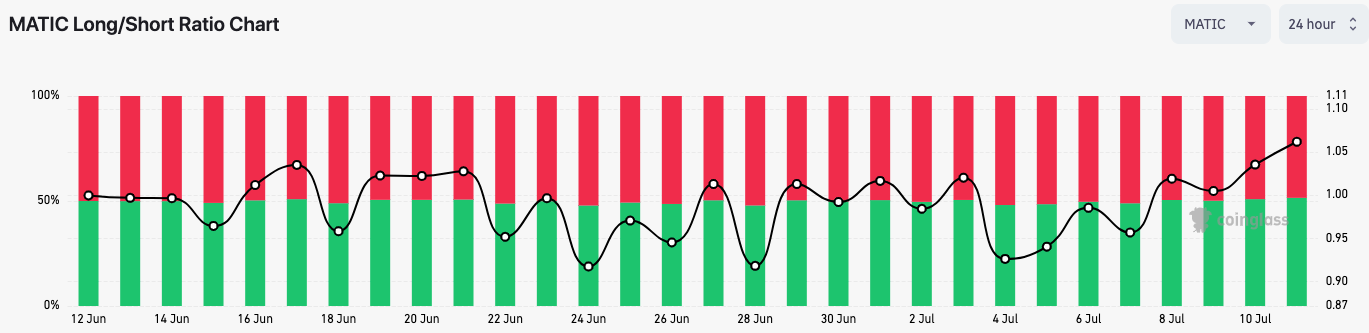
- Buying pressure increased and a majority of traders opened long positions.
Polygon (MATIC) recovered from its week-long consolidation, as it gained 7.46% against Bitcoin (BTC) and 7.47% against Ethereum (ETH). All of these, which happened in the last 24 hours, ensured that MATIC beat the $0.72 resistance which appeared on July 4.
From the daily chart, MATIC could not surpass $0.72 after a series of bullish orders on July 1. However, after the rise to $0.72, selling pressure drew back the pivot, and MATIC fell back to the $0.65 demand area.
More Capital and the Price Rises
However, bulls had other plans, and as buying pressure increased, MATIC was able to grace a new high at $0.74. Besides the positive price reaction, the Chaikin Money Flow (CMF) indicated that a high level of liquidity had entered into MATIC in the last 21 days.
Also, the CMF was in the positive territory at 0.04. Thus, this indicates more buying pressure when considering the money flowing into the asset. However, traders may need to watch the CMF trending southward.
If it continues in that direction, then, capital inflow into MATIC might reduce. This could negate the bullish bias. In turn, it could affect MATIC’s price action negatively while the price could fall back to the $0.65 region.
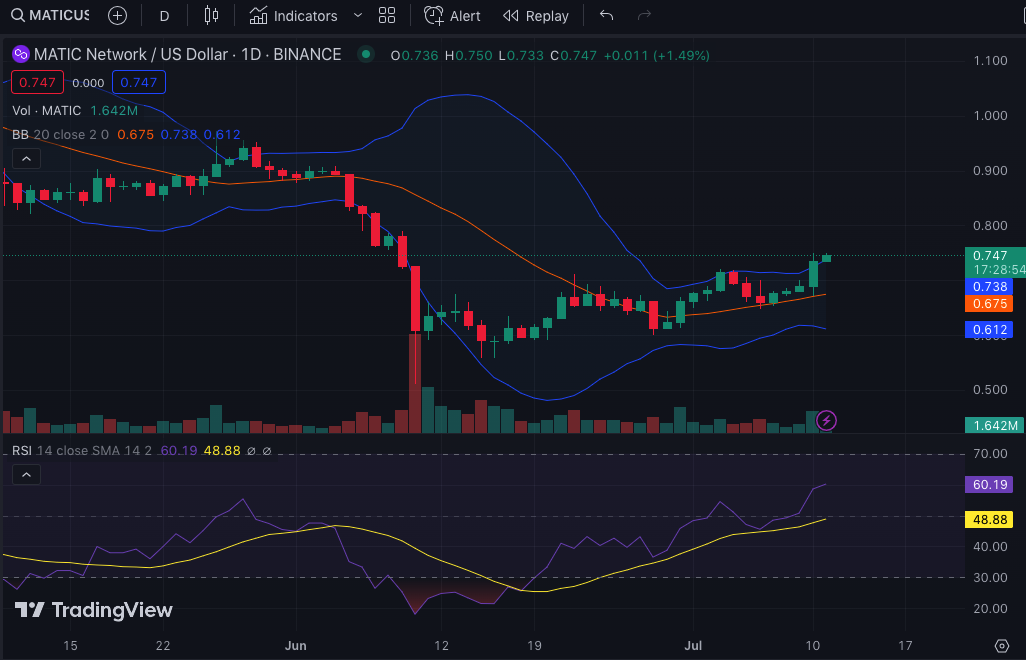
Meanwhile, the Relative Strength Index (RSI) had moved above the neutral value of 50. At 59.63, the RSI suggests that there are more buyers in the market than sellers. Therefore, the potential for a further price increase still exists.
Possible Retracement But Traders Stay Bullish
Nonetheless, it might also be necessary to watch for the volatility level, as shown by the Bollinger Bands (BB). At press time, MATIC’s volatility had exited extreme levels. But the asset price at $0.74 touched the upper band.
This suggests that MATIC might be overbought. Furthermore, the price could retrace unless the demand, backed by the RSI, resists a pullback.
Additionally, derivatives information portal Coinglass revealed that many traders were bullish on MATIC irrespective of the indicators. This was shown by the long/short ratio which had increased to 1.06.
Typically, the long/short ratio above 1 suggests that there are more long positions than shorts. But when the ratio is below 1, it means that the average sentiment is bearish.
So, MATIC’s long/short ratio at 1.06 means that 51.5% of traders were bullish on MATIC. On the other hand, 48.5% were bearish.
In conclusion, MATIC’s next direction could be dicey. But as it stands, it is highly unlikely that the token plunges below $0.65. Also, if buying pressure continues to supersede sell orders, then the value might price higher than $0.74.
Disclaimer: The views, opinions, and information shared in this price prediction are published in good faith. Readers must do their research and due diligence. Any action taken by the reader is strictly at their own risk. Coin Edition and its affiliates will not be liable for direct or indirect damage or loss
Disclaimer: The information presented in this article is for informational and educational purposes only. The article does not constitute financial advice or advice of any kind. Coin Edition is not responsible for any losses incurred as a result of the utilization of content, products, or services mentioned. Readers are advised to exercise caution before taking any action related to the company.


