


- MATIC faces resistance at $0.5216, but a rebound to $0.5250 is possible with positive momentum.
- Rising trading volume suggests growing interest in MATIC despite a 2.19% drop.
- Oversold RSI and stochastic RSI hint at short-term bounce potential for MATIC.
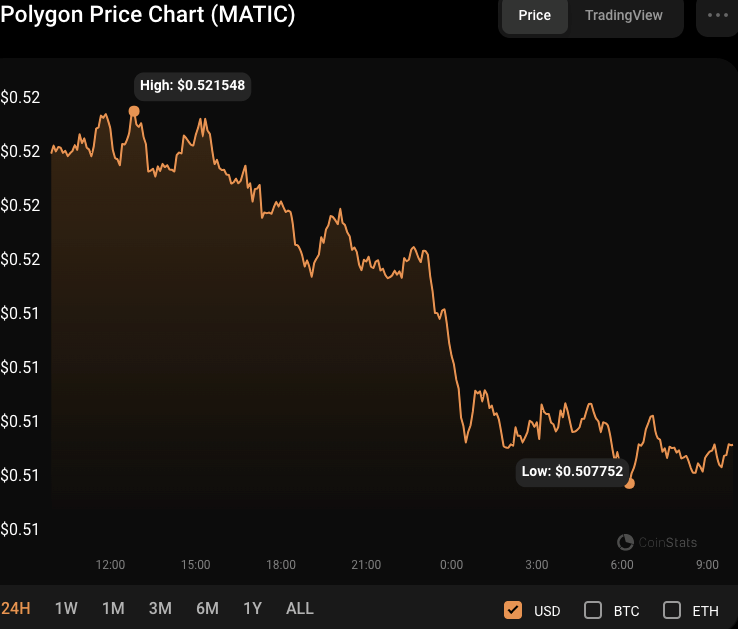
The Polygon (MATIC) market has been in a downtrend for the last 24 hours, with optimistic efforts at a recovery being thwarted at the day’s intraday high of $0.5216. Consequently, pessimism prevailed, and the price dropped to a new 7-day low of $0.5085 before finding support. The MATIC market was still experiencing negative momentum at press time, resulting in a 2.19% drop to $0.5093.
If bearish pressure pushes MATIC below $0.5085, the next support level to watch is around $0.5050. However, a rebound toward the next resistance level at $0.5250 is possible if the market finds positive momentum and breaks above the intraday high of $0.5216.
MATIC’s market capitalization fell by 2.19% to $0.5085 during the decline, while 24-hour trading volume increased by 2.46% to $210,244,252. This rise in trading volume implies greater interest and activity in the MATIC market, which might indicate a change in traders’ attitudes.
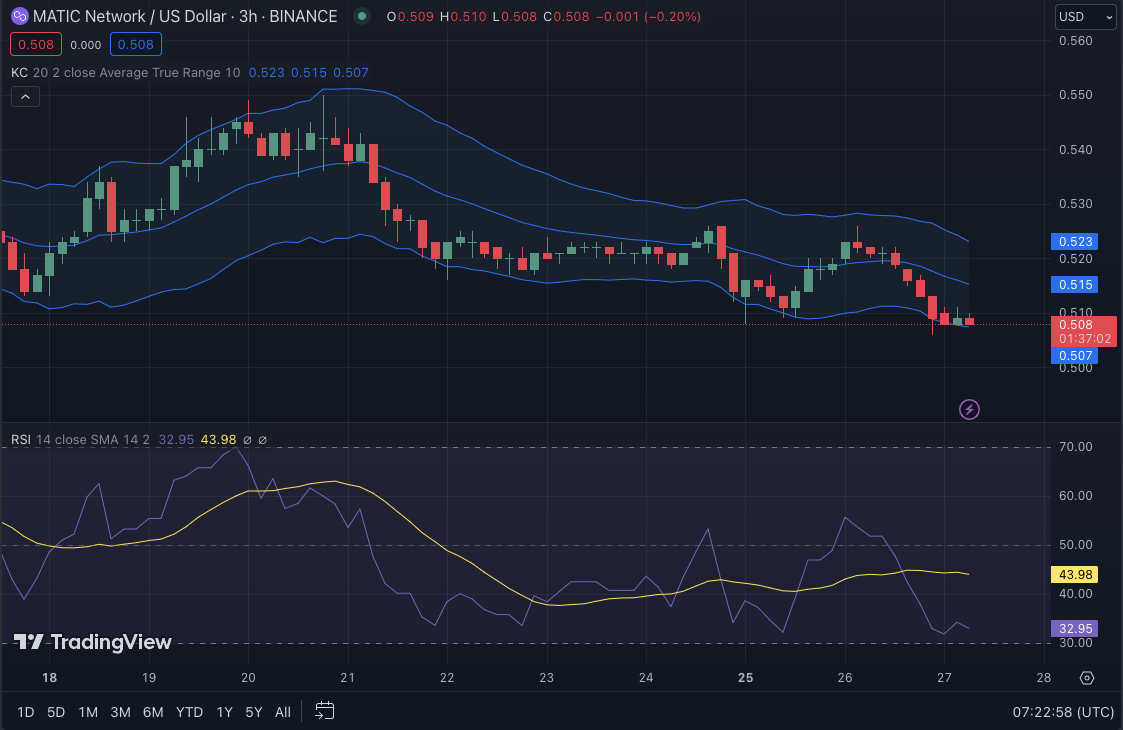
The Keltner Channel bands are moving south, with the top, middle, and lower bands touching $0.523, $0.515, and $0.507, respectively. This pattern suggests a decreasing price range and possible consolidation shortly. However, the price action has reached the lower band and created a modest upward momentum, indicating a likely rebound from the present support level.
The market is now mildly oversold with a Relative Strength Index of 34.22. This move might result in a short-term bounce as traders hunt for buying opportunities at these lower levels.
However, if the RSI falls below 30, it may suggest that the current trend will continue and have more significant downside potential. On the other hand, if the RSI begins to rise and rises over 40, it may indicate a change toward more optimistic market sentiment and probable rising momentum.
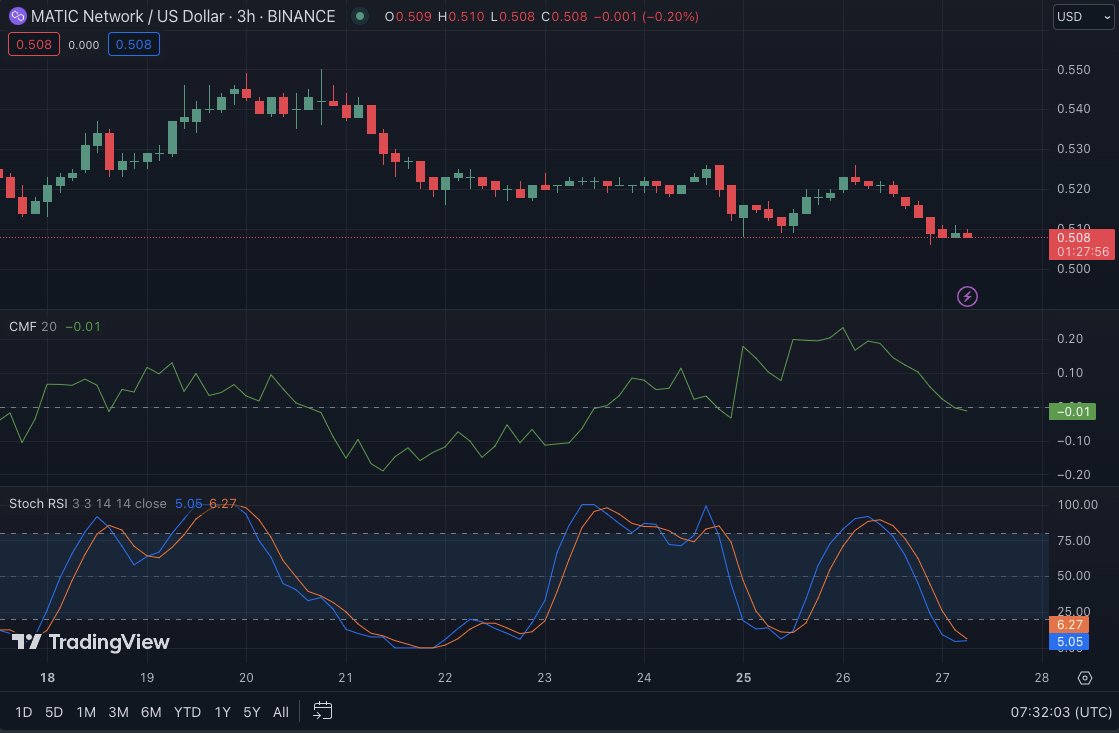
With a value of 5.05, the stochastic RSI trend in the oversold area indicates that the market is now under significant selling pressure. This level may result in a short-term rebound, as traders may perceive it as a chance to purchase at a bargain.
A climb over 20 and a reversal in the stochastic RSI from an oversold area might indicate the beginning of a bullish trend. This might draw additional purchasers to the market, increasing prices and generating upward momentum.
Furthermore, the Chaikin Money Flow (MFI) rating of -0.01 indicates a minor outflow of money from the market. However, if this rating improves and moves into positive territory, it may suggest a change in investor mood toward purchasing, which might support an upcoming market rebound.
In conclusion, MATIC’s current dip offers potential buying opportunities, with indicators hinting at a possible rebound.
Disclaimer: The views, opinions, and information shared in this price prediction are published in good faith. Readers must do their research and due diligence. Any action taken by the reader is strictly at their own risk. Coin Edition and its affiliates will not be liable for direct or indirect damage or loss.
Disclaimer: The information presented in this article is for informational and educational purposes only. The article does not constitute financial advice or advice of any kind. Coin Edition is not responsible for any losses incurred as a result of the utilization of content, products, or services mentioned. Readers are advised to exercise caution before taking any action related to the company.


