


- MATIC fell from $0.88 to $0.85 following a $7.75 million sell-off.
- The ability to defend the $0.85 support might send the token toward $0.95.
- If buying pressure decreases, bears might pull MATIC down to $0.80.
The price of Polygon (MATIC) slid after the Polygon Foundation sent 9 million tokens worth $7.75 million to Binance on February 13. According to Spot On Chain, the recent transaction was only one of many that have taken place in the last five days.
In the post published on X, two wallets linked to the Foundation sent a total of 15.5 million to the exchange at an average price of $0.85, just before the latest one.
Sending large volumes of tokens to exchanges suggests that a participant was selling. Therefore, MATIC, whose price had initially hit $0.88, dropped to $0.85.
Bulls Aim to Defend Support
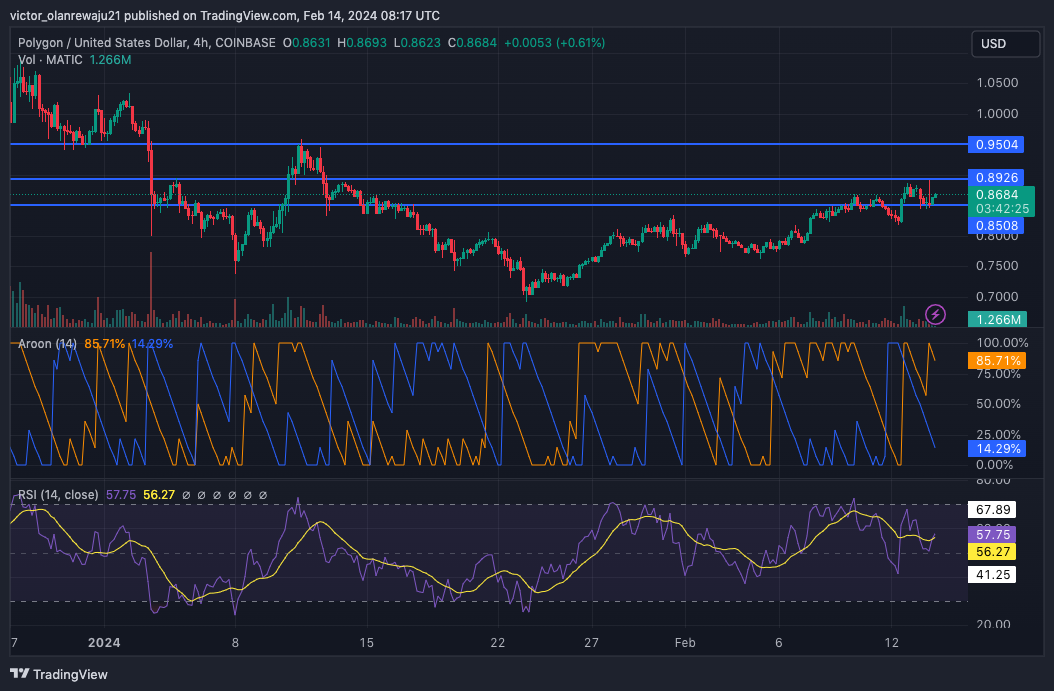
From the MATIC/USD 4-hour chart, the token had a bullish engulfing candle on February 12. This candlestick pushed the price as high as $0.88. However, with an overhead resistance at $0.89, MATIC’s price fell.
At press time, the token was changing hands at $0.86. Technical indicators like the Aroon showed that MATIC’s price might not nosedive harder than it has. As of this writing, the Aroon Down (blue) was 14.39%.
The Aroon Up (orange), on the other hand, was 85.71%, indicating that sellers had not yet put bulls out of the way. In a bearish condition, MATIC might drop back to $0.85. This zone served as a support area. Should the bulls defend the zone, then MATIC might evade a decline as low as $0.80.
MATIC May Sink Further
But if the condition is highly bullish, MATIC might breach the $0.89 resistance. If this is the case, the value of the token might hit $0.95, which seemed like the next hurdle to cross. If buying pressure increases at this point, the cryptocurrency might close in on $1.
Another indicator Coin Edition looked at was the Relative Strength Index (RSI). At press time, the RSI was 57.75. Previously, the reading had initially hit 66.80 on February 13. But with some sell-offs, buying momentum dropped and pushed down the reading.
If bulls come back with the force they had earlier, MATIC might rebound toward $0.90. However, failure to improve on the previous buying pressure might send the price down. If care is not taken and bears regain control, MATIC might lose hold of the $0.85 support. In this instance, the price might sink to $0.80.
Disclaimer: The information presented in this article is for informational and educational purposes only. The article does not constitute financial advice or advice of any kind. Coin Edition is not responsible for any losses incurred as a result of the utilization of content, products, or services mentioned. Readers are advised to exercise caution before taking any action related to the company.
 Price Prediction 2026, 2027, 2028, 2029, 2030 -2050")


