


- Recent price study shows a declining market for Polygon (MATIC).
- Technical indicators urge investors to be cautious in the near future.
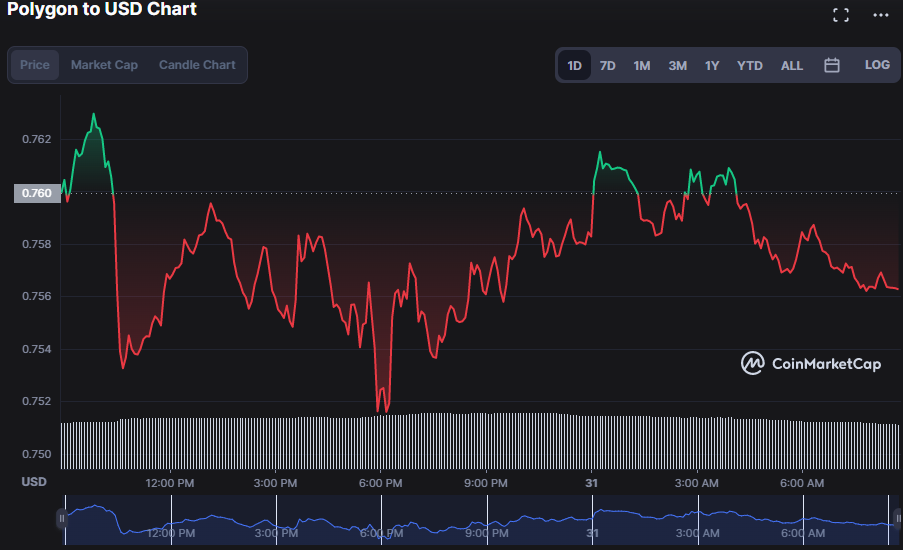
- In the midst of the decline, MATIC prices are facing resistance at $0.7633.
Polygon (MATIC) began the day with bullish dominance; however, after hitting an intraday high of $0.7633, the bulls began to lose ground. The bears pounced on the opportunity, and the MATIC price fell gradually until it reached support at $0.7516.
As of this writing, bears had succeeded in pushing the MATIC price down to $0.7574, a 0.58% slump.
This negative momentum has resulted in a 0.58% drop in market capitalization and a 6.60% drop in 24-hour trading volume, to $6,601,209,241 and $177,215,558 respectively.
Bollinger bands are contracting, with the upper band reaching $0.7803 and the lower band touching $0.7442, indicating that market volatility is decreasing. This negative trend is strengthened when the price moves closer to the bottom band, suggesting more depreciation.
The stochastic RSI drops below its signal line at 75.17, indicating that the recent downtrend in MATIC has not yet reached its peak. The fact that it’s pointing down suggests that the bears’ momentum is picking up, which might mean that another downswing is on the way.
The MACD blue line’s upward rise above the signal line at -0.0069, however, is giving MATIC market investors cause for hope. Further, given that the histogram is moving in the positive range, traders should be on the lookout for a potential bullish reversal in the near future.

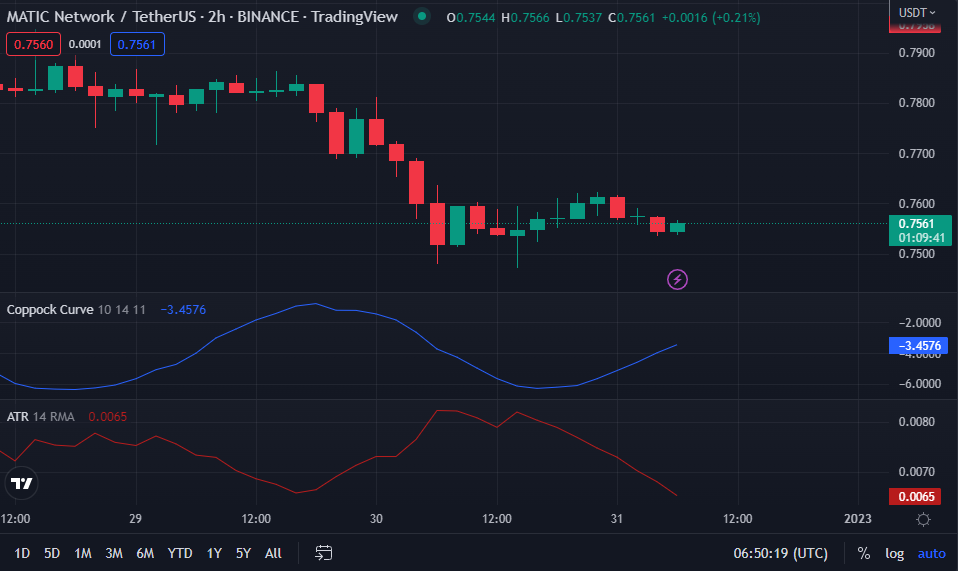
The MATIC market is being controlled by bears, as shown by the reading of -3.4433 on the Coppock Curve. This negative trend is being muted by the Coppocks curve, which is rising as it nears the zero line, alerting investors that the market may soon see a reversal.
The optimistic tone of the MATIC price chart is bolstered by the positive average true range (ATR), which is now at 0.0065. This positive outlook, however, is dampened by its downward inclination.
Bulls must hold the resistance level and drive MATIC prices higher to reverse this dismal trend.
Disclaimer: The views and opinions, as well as all the information shared in this price analysis, are published in good faith. Readers must do their own research and due diligence. Any action taken by the reader is strictly at their own risk. Coin Edition and its affiliates will not be held liable for any direct or indirect damage or loss.
Disclaimer: The information presented in this article is for informational and educational purposes only. The article does not constitute financial advice or advice of any kind. Coin Edition is not responsible for any losses incurred as a result of the utilization of content, products, or services mentioned. Readers are advised to exercise caution before taking any action related to the company.


