


, Shiba Inu (SHIB) and MemeCore (M)")
- Dogecoin remains in a strong downtrend below major EMAs with $0.0715 at risk support zone critical.
- Shiba Inu holds key support but remains below all major EMAs with weak momentum.
- MemeCore shows extreme volatility after collapse with $0.58 support under pressure.
Meme coins continue to trade under heavy pressure as the broader cryptocurrency market struggles to regain momentum. Dogecoin (DOGE), Shiba Inu (SHIB), and MemeCore have all extended their declines, leaving traders focused on whether key support levels can prevent another wave of selling.
Technical indicators across the three charts continue to favor sellers, while moving averages and Fibonacci resistance zones limit recovery attempts. Although oversold conditions could trigger short-term rebounds, each token must reclaim important resistance levels before sentiment can shift toward a sustained recovery.
Dogecoin Price Prediction: DOGE Struggles to Escape Bearish Momentum
Dogecoin continues to trade within a well-established downtrend after losing several important support levels. The meme coin currently changes hands near $0.0724, while price action continues to form lower highs and lower lows. This structure reflects persistent selling pressure and weak buying interest.
Additionally, DOGE remains below its 20-day, 50-day, 100-day, and 200-day exponential moving averages. Those indicators now create multiple resistance barriers, making any recovery increasingly difficult.
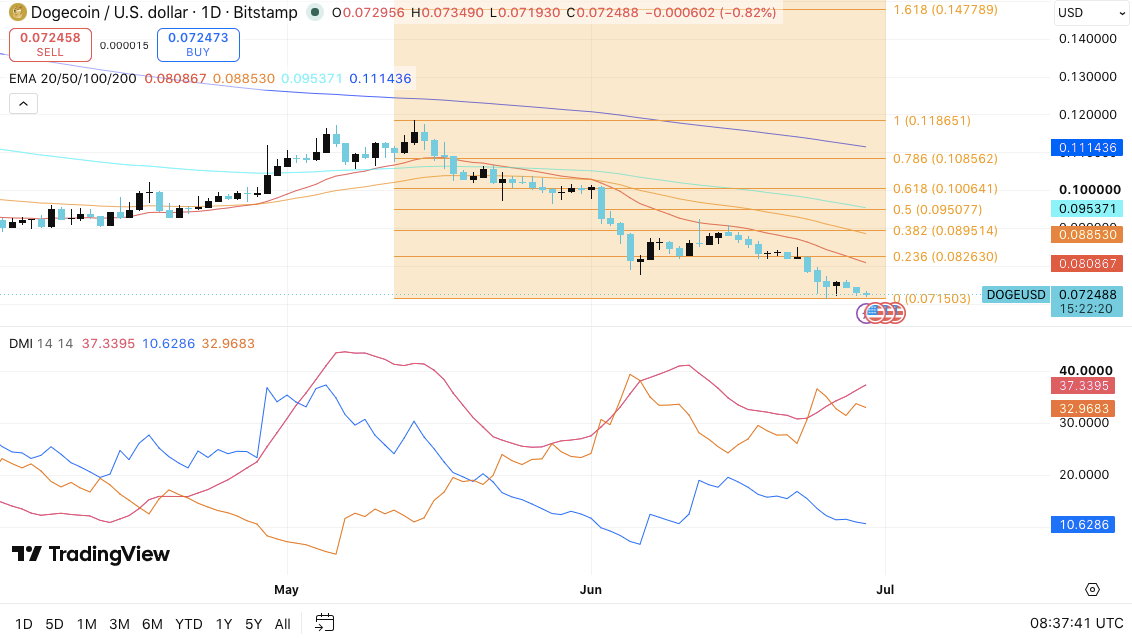
The latest decline began after Dogecoin failed to hold above the Fibonacci resistance near $0.1186. Since then, the token has slipped below the 0.236 Fibonacci level at $0.0826 and now trades close to the 0 Fibonacci support around $0.0715.
This support zone has become the market’s immediate focus. A daily close below $0.0715 could accelerate losses toward the psychological $0.0700 level. Consequently, sellers may target $0.0650 before testing stronger historical demand near $0.0600.
Related: Velvet Price Prediction 2026, 2027, 2028, 2029, 2030-2050
Momentum indicators continue to support the bearish outlook. The Average Directional Index remains elevated near 37, confirming a strong trend. Moreover, the negative directional indicator continues to hold comfortably above the positive indicator, signaling that sellers still control market direction.
Any meaningful recovery would require DOGE to reclaim the $0.0808 to $0.0826 region. A sustained move above $0.0895 would improve the broader technical structure and reduce downside pressure.
Shiba Inu Price Prediction: SHIB Defends a Key Demand Zone
Shiba Inu also remains under significant pressure after an extended decline from recent highs. The token trades around $0.00000416 and continues to hold just above its latest swing low. Price action still reflects a series of lower highs and lower lows, reinforcing the prevailing bearish trend.
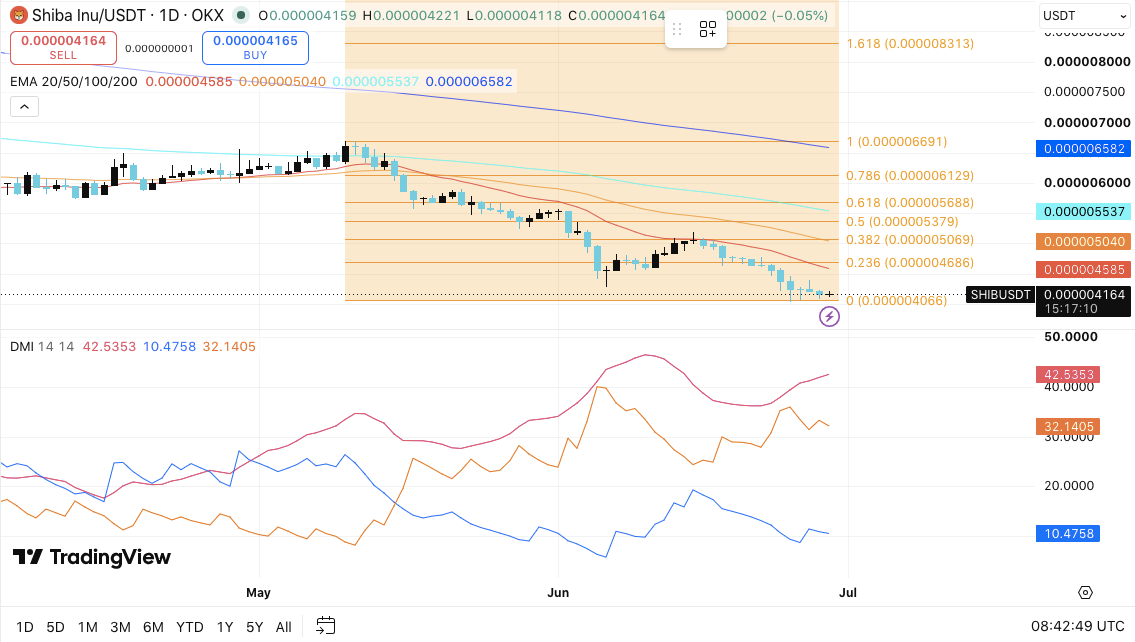
Furthermore, SHIB remains below every major exponential moving average. The 20-day EMA sits near $0.00000458, while the 50-day EMA rests around $0.00000504. These levels now represent the first obstacles for any recovery attempt.
Technical momentum also favors the bears. The Directional Movement Index shows an ADX reading near 42, indicating a strong trend. Besides that, selling pressure continues to outweigh buying activity by a wide margin.
Support between $0.00000400 and $0.00000406 has become increasingly important. If buyers fail to defend this area, SHIB could extend its decline toward the $0.00000380 to $0.00000390 range.
Related: Top 3 Crypto Price Predictions Today: Bitcoin (BTC), Ethereum (ETH), and XRP
However, a successful rebound above the 20-day EMA would provide the first sign of improving sentiment. Additionally, a move beyond $0.00000504 could open the door for a stronger recovery toward higher resistance zones.
MemeCore Price Prediction: MemeCore Faces High Volatility After Sharp Collapse
MemeCore presents the weakest technical picture among the three assets after suffering a dramatic collapse. The token plunged from above $2.60 to below $0.60 in a single aggressive selloff, breaking beneath every major moving average during the decline.
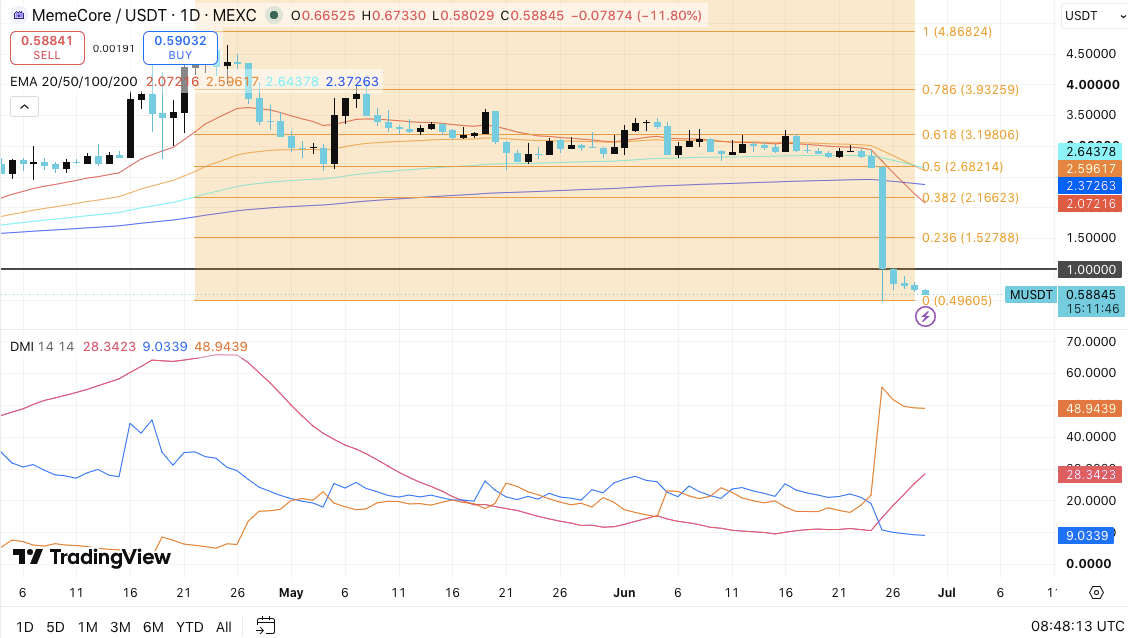
The current price remains close to $0.588, placing immediate attention on support between $0.58 and $0.60. Significantly, this area now represents the first line of defense against another leg lower.
If sellers push the token below the psychological $0.50 level, downside targets around $0.40 and even $0.30 could quickly come into focus. Limited historical support below current prices increases the risk of continued volatility.
Meanwhile, several resistance levels stand in the way of any recovery. The first hurdle appears between $0.75 and $0.80, followed by the important $1.00 level. Beyond that, Fibonacci resistance levels between $1.53 and $3.93 create additional obstacles for bullish traders.
Related: Cardano Price Prediction: Can SecondFi’s Recovery Plan Pull ADA Out Of Its Slump?
The Directional Movement Index also reflects overwhelming bearish momentum, with sellers maintaining a decisive advantage over buyers. Consequently, MemeCore must stabilize above current support before traders can consider a meaningful recovery scenario.
Disclaimer: The information presented in this article is for informational and educational purposes only. The article does not constitute financial advice or advice of any kind. Coin Edition is not responsible for any losses incurred as a result of the utilization of content, products, or services mentioned. Readers are advised to exercise caution before taking any action related to the company.


