


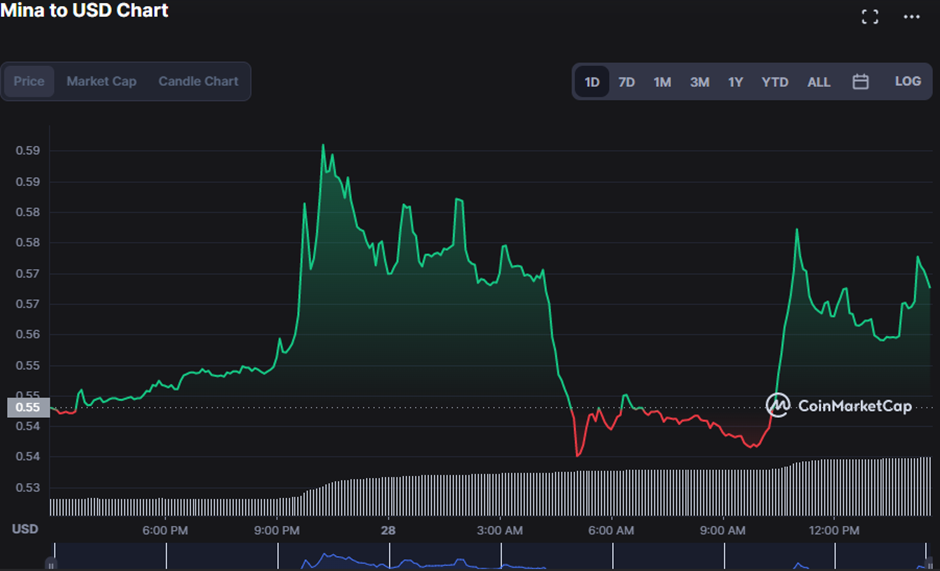
- MINA had support around $0.5398 and resistance at $0.5938 on the last day.
- The price of MINA grew by more than 2.58% over the previous 24 hours.
- Mina Price Analysis shows a strong bullish market sentiment.
A brief bearish hold caused prices to drop to an intraday low of $0.5398, interrupting Mina’s (MINA) ongoing bullish trend; however, bulls quickly reclaimed the market and raised prices to $0.5621, a gain of 2.58%.
During this upswing, the market capitalization and 1-day trading volume increased by 3.76% to $427,770,245 and 259.32% to $29,606,959, respectively, in support of the notion of a long-lasting rally.
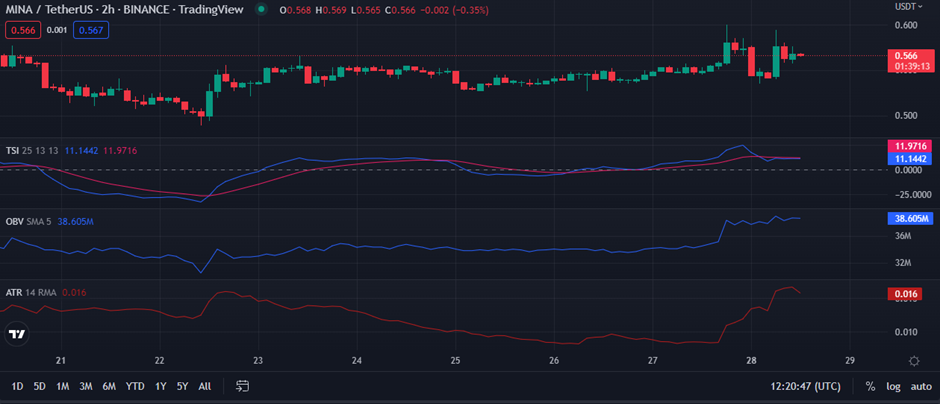
The True Strength Indicator’s (TSI) dip below the signal line, which suggests that bear dominance is likely to take over the market, dampening investors’ prospects for a continuous uptrend. The TSI is reading 11.3262, but the signal line is at 11.9976.
The price and OBV are developing higher peaks and troughs, indicating that the surge is likely to continue. The upward-trending OBV line, which is at 35.656M, shows that purchasing volume is outperforming selling volume and that MINA prices will continue on their upward trend.
The volatility of Mina (MINA) is decreasing, as indicated by the Average True Range (ATR) line, which is pointing south and has a level of 0.016. Additionally, this ATR movement is a cautionary sign for traders to exercise caution going forward.
The bulging Bollinger Bands, with the upper band touching 0.580 and the lower band touching 0.534, classify the rising trade volume. The price movement towards the top band also encourages the MINA pricing to continue rising.
A negative reversal is anticipated as the Stoch RSI, which has a reading of 35.69 and is pointing south, approaches the oversold area. This stance warns investors to keep a close eye on things going forward.
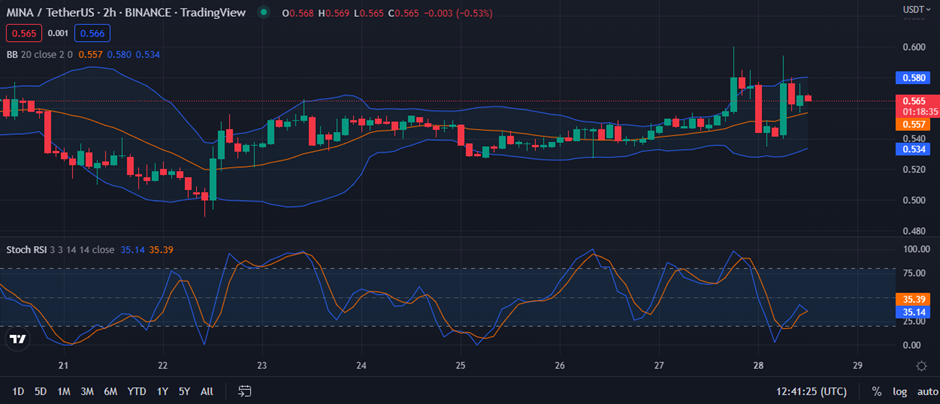
Overall, the bears seem exhausted since the technical indicators are moving north, insinuating that the bullish trend may persist.
Disclaimer: The views and opinions, as well as all the information shared in this price prediction, are published in good faith. Readers must do their research and due diligence. Any action taken by the reader is strictly at their own risk. Coin Edition and its affiliates will not be held liable for any direct or indirect damage or loss.
Disclaimer: The information presented in this article is for informational and educational purposes only. The article does not constitute financial advice or advice of any kind. Coin Edition is not responsible for any losses incurred as a result of the utilization of content, products, or services mentioned. Readers are advised to exercise caution before taking any action related to the company.
 Price Prediction: Can BTW Sustain Its Breakout Above $0.1032?")


