


 Price Prediction 2023-2030: Will MINA Reach $1 Soon?")
- Bullish MINA price prediction ranges from $1.902 to $2.082.
- MINA price might also reach $2 in 2023.
- MINA’s bearish market price prediction for 2023 is $0.399.
Described as the “world’s lightest blockchain,” Mina Protocol is an open-source protocol with the aim of providing “true decentralization,” scalability, and security to the community. One of the main reasons why the Mina protocol is known as the world’s lightest blockchain is because it maintains a constant size of 22kB. This will allow anyone to operate a node and secure the network without any requirement for any sophisticated software.
With the utilization of zero-knowledge-proof technology, Mina has already caught the eye of various investors. The continuous development and comprehensive roadmap of the Mina Protocol could be another factor that could increase the demand for MINA, the native token of the Mina Protocol.
Let’s now take a detailed look at Mina Protocol’s operations and its native token, MINA. Moreover, this article will conduct a comprehensive analysis of MINA and forecast the price for 2023, 2024, 2025, 2026, till 2050.
Table of contents
- Mina (MINA) Market Overview
- What is Mina (MINA)?
- MINA Current Market Status
- MINA Price Analysis 2023
- MINA Price Prediction 2023-2030 Overview
- Mina (MINA) Price Prediction 2023
- MINA Price Prediction 2024
- MINA Price Prediction 2025
- MINA Price Prediction 2026
- MINA Price Prediction 2027
- MINA Price Prediction 2028
- MINA Price Prediction 2029
- MINA Price Prediction 2030
- MINA Price Prediction 2040
- MINA Price Prediction 2050
- Conclusion
- FAQ
Mina (MINA) Market Overview
HTTP Request Failed... Error: file_get_contents(https://pro-api.coinmarketcap.com/v2/cryptocurrency/quotes/latest?slug=mina-protocol): Failed to open stream: HTTP request failed! HTTP/1.1 429 Too Many Requests
What is Mina (MINA)?
Described as the “world’s lightest blockchain,” Mina Protocol is an open-source protocol with the aim of providing “true decentralization,” scalability, and security to the community. One of the main reasons why the Mina protocol is known as the world’s lightest blockchain is because it maintains a constant size of 22kB. This will allow anyone to operate a node and secure the network without any requirement for any sophisticated software.
One of the main issues that Mina protocol hopes to tackle is the size issue that is often observed in the community. The developers of the Mina Protocol have incorporated a zero-knowledge proof technology called zk-SNARKS to create a blockchain that greatly reduces the need for computational power required in a network.
Apart from the zk-SNARKs, the Mina Protocol has also combined it with the Proof-of-Stake consensus mechanism. Moreover, the Mina Protocol claims that the network is secured by participants like the Block Producers and Snark Producers.
MINA, the native token of the Mina Protocol, can act as a utility token within the network to execute network transactions. Alike other altcoins, MINA can also be exchanged for other tokens. Moreover, users can earn rewards with MINA when they choose to stake Mina Protocol’s native token. Block Producers and Snark Producers can also earn incentives with MINA when they prove a transaction validity.
MINA Current Market Status
MINA is ranked in the 75 position based on its market capitalization, according to CoinMarketCap. The current circulating supply of Mina’s native token is 890,425,107 MINA, while its total supply is 1,026,222,653.
Moreover, MINA is priced at $0.7416, experiencing a 22.43% surge in seven days. With a market cap of $738,951,442, MINA also witnessed a 25.40% spike in 24 hours. Moreover, MINA is currently experiencing a rising demand as the trading volume, valued at $237,248,076, experienced a spike of 643.86% in one day.
Some of the crypto exchanges for trading MINA are currently Binance, OKX, CoinBase, Kraken, and KuCoin.
Now, let’s dive further and discuss the price analysis of Mina Protocol’s native token, MINA, for 2023.
MINA Price Analysis 2023
Will the MINA blockchain’s most recent improvements, additions, and modifications help its price rise? Moreover, will the changes in the payment and crypto industries affect MINA’s sentiment over time? Read more to find out about MINA’s 2023 price analysis.
MINA Price Analysis – Bollinger Bands
The Bollinger Bands (BB) are a technical analysis tool that is used to analyze price movement and volatility. Bollinger Bands (BB) utilize the time period and the standard deviation of the price. Normally, the default value of BB’s period is set at 20. The upper band of the BB is calculated by adding 2 times the standard deviations to the Simple Moving Average (SMA), while the lower band is calculated by subtracting 2 times the standard deviation from the SMA. Based on the empirical law of standard deviation, 95% of the data sets will fall within the two standard deviations of the mean.
The candlesticks were initially moving sideways inside the Bollinger Bads. However, during the last few days of October, the candlesticks climbed to the top-half of the Bollinger Bands and continued to form green bars. The green candlesticks started to grow, showed signs of immense strength in their trend, and broke above the upper band. This caused MINA to face a slight retracement. At the reported time, the newly formed green candlestick’s wick is almost touching the upper band of the Bollinger Bands.
MINA Price Analysis – Relative Strength Index (RSI)
The Relative Strength Index (RSI) is a momentum indicator utilized to find out the current trend of the price movement and determine if it is in the oversold or overbought region. Traders often use this tool to make decisions about when to buy or sell the tokens. When the RSI is often valued below or at 30, it is considered an oversold region, and a price correction could happen soon. Moreover, when the RSI is valued above or at 70, it is regarded as an overbought region, and traders expect the price to fall soon.
The RSI has finally confirmed that the previous spike and current surge were caused by the overbuying activities of the traders. The indicator initially made a bearish cross after its first massive spike, then stayed below the SMA for some time. However, the RSI, once again, made a bullish cross, which made it cross the overbought region. The RSI is currently valued at 72.29 and may continue to move upward as it is pointed at the 80 level.
MINA Price Analysis – Moving Averages Convergence Divergence (MACD)
The Moving Average Convergence Divergence (MACD) indicator can be used to identify potential price trends, momentums, and reversals in markets. MACD will make the reading of a moving average cross easier. The MACD indicator is calculated by subtracting the long-term EMA (Exponential Moving Average) indicator from the short-term EMA. Normally, the default values for the MACD are set at the 12-day EMA, 26-day EMA, and 9-day EMA. Moreover, MACD is considered a lagging indicator as it cannot provide trade signals without any past price data. MACD plays an important role, as it can confirm trends and identify potential reversals.
Looking at the MACD indicator, green bars were growing massively during the massive spike. Furthermore, during the retracement stages, red bars formed as the MACD line fell below the signal line. However, the recent touch between the MACD line and signal line could signal that the bullish run may continue to run as a tiny hint of green is still forming.
MINA Price Prediction 2023-2030 Overview
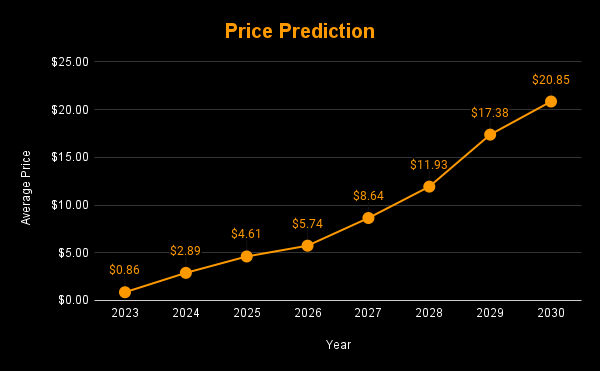
| Year | Minimum Price | Average Price | Maximum Price |
| 2023 | $0.56 | $0.86 | $2.08 |
| 2024 | $1.67 | $2.89 | $4.32 |
| 2025 | $3.02 | $4.61 | $6.51 |
| 2026 | $4.53 | $5.74 | $7.48 |
| 2027 | $7.69 | $8.64 | $10.95 |
| 2028 | $10.89 | $11.93 | $13.08 |
| 2029 | $16.55 | $17.38 | $18.47 |
| 2030 | $19.15 | $20.85 | $22.65 |
| 2040 | $46.71 | $48.59 | $53.64 |
| 2050 | $67.39 | $68.32 | $72.17 |
Mina (MINA) Price Prediction 2023
The first major spike broke through the $0.5149 and $0.6915 resistance levels. After the first major spike, the candlesticks faced a slight retracement. However, after the retracement, the candlesticks once again rose, and it was confirmed that traders were accumulating. Bull vs. Bear Power also confirms that the presence is under the surveillance of the bulls, showing growing signs of its trend.
Meanwhile, the price prediction of MINA for 2023 remains bullish and is expected to reach beyond the level of $1.929. The bearish price prediction range for MINA is between $0.561 and $0.399. On the off chance that MINA experiences extremely bullish behavior, it will cross $2.8.
| Bullish Price Prediction | Bearish Price Prediction |
| $1.902 – $2.082 | $0.399 – $0.561 |
MINA Price Prediction – Resistance and Support Levels
Looking at the chart, MINA is currently trading between the weak resistance and the support. If MINA breaks through the weak resistance, there is a high possibility that the altcoin could trade at $1.929. If 2023 proves to be extremely bullish, then MINA could reach the 0.236 Fib level, which is the extremely bullish price level for the altcoin. However, if MINA continues to face the bears’ attack, then the altcoin may trade at the support level of $0.360 or even lower.
MINA Price Prediction 2024
Traders are looking forward to this year as it could be a historic moment for cryptocurrencies, as the Bitcoin halving is expected to happen in 2024. Most of the time, whenever BTC rises, traders have observed a similar surge in the altcoins. MINA could also be affected by Bitcoin halving and could trade beyond the price of $4 by the end of 2024.
MINA Price Prediction 2025
MINA could still experience the after-effects of the Bitcoin halving and is expected to trade above its 2024 price. Many trade analysts speculate that BTC halving could create a huge impact on the crypto market. Moreover, similar to many altcoins, MINA will continue to rise in 2025, forming new resistance levels. It is expected that MINA will trade beyond the $6 level.
MINA Price Prediction 2026
It is expected that after a long period of bull runs, the bears will come into power and start negatively impacting cryptocurrencies. During this bearish sentiment, MINA could tumble into its support region of $5. Moreover, when MINA remains in the oversold region, there could be a price correction soon. MINA, by the end of 2026, could be trading beyond the $7 resistance level after experiencing the price correction.
MINA Price Prediction 2027
Naturally, traders expect bullish market sentiment after the crypto industry was negatively affected by the bears’ claw. MINA is expected to rise after its slumber in the bear season. Moreover, MINA could even break more resistance levels as it continues to recover from the bearish run. Therefore, MINA is expected to trade at $10 by the end of 2027.
MINA Price Prediction 2028
Once again, the crypto community is looking forward to this year, as there will be a Bitcoin halving. Like many altcoins, MINA will continue to form new higher highs and is expected to move on an upward trajectory. Hence, MINA would be trading at $13 after experiencing a massive surge by the end of 2028.
MINA Price Prediction 2029
2029 is expected to be another bull run due to the aftermath of the BTC halving. However, traders speculate that the crypto market will gradually become stable by this year. In tandem with the stable market sentiment and the slight price surge expected after the aftermath, MINA could be trading at $18 by the end of 2029.
MINA Price Prediction 2030
After witnessing a bullish run in the market, MINA and many altcoins would show signs of consolidation and might trade sideways for some time while experiencing minor spikes. Therefore, by the end of 2030, MINA could be trading at $22.
MINA Price Prediction 2040
The long-term forecast for MINA indicates that this altcoin could reach an all-time high (ATH). This would be one of the key moments, as HODLERS may expect to sell some of their tokens at the ATH point. However, MINA may face a slight fall before starting its upward journey once again. It is expected that the average price of MINA could reach $50 by 2040.
| Minimum Price | Average Price | Maximum Price |
| $46.71 | $48.59 | $53.64 |
MINA Price Prediction 2050
The community believes that there will be widespread adoption of cryptocurrencies, which could maintain gradual bullish gains. By the end of 2050, if the bullish momentum is maintained, MINA could surpass the resistance level of $70.
| Minimum Price | Average Price | Maximum Price |
| $67.39 | $68.32 | $72.17 |
Conclusion
MINA has been on the watch-out list of many investors as it aims to make its mark in the blockchain industry. If investors continue to show interest in MINA and these tokens in their portfolios, then it could continue to rise. MINA’s bullish price prediction shows that it could pass beyond the $1.902 level. Moreover, MINA could surpass the $70 level by the end of 2050.
FAQ
Described as the “world’s lightest blockchain,” Mina Protocol is an open-source protocol with the aim of providing “true decentralization,” scalability, and security to the community. One of the main reasons why the Mina protocol is known as the world’s lightest blockchain is because it maintains a constant size of 22kB. This will allow anyone to operate a node and secure the network without any requirement for any sophisticated software.
MINA can be traded on many crypto exchanges such as Binance, OKX, CoinBase, Kraken, and KuCoin.
It was launched in 2020.
MINA achieved its All-Time High of $9.9141 in June 2021.
MINA is expected to reach $1.9 by 2023.
MINA is expected to reach $4 by 2024.
MINA is expected to reach $6 by 2025.
MINA is expected to reach $7 by 2026.
MINA is expected to reach $10 by 2027.
MINA is expected to reach $13 by 2028.
MINA is expected to reach $18 by 2029.
MINA is expected to reach $22 by 2030.
MINA is expected to reach $50 by 2040.
MINA is expected to reach $70 by 2050.
Disclaimer: The views and opinions, as well as all the information shared in this price prediction, are published in good faith. Readers must do their own research and due diligence. Any action taken by the reader is strictly at their own risk. Coin Edition and its affiliates will not be held liable for any direct or indirect damage or loss.
More Crypto Price Predictions:
- Loopring (LRC) Price Prediction 2023-2030
- Neo (NEO) Price Prediction 2023-2030
- Ravencoin (RVN) Price Prediction 2023-2030
- Spell Token (SPELL) Price Prediction 2023-2030
Disclaimer: The information presented in this article is for informational and educational purposes only. The article does not constitute financial advice or advice of any kind. Coin Edition is not responsible for any losses incurred as a result of the utilization of content, products, or services mentioned. Readers are advised to exercise caution before taking any action related to the company.


