


 Price Prediction 2023-2030: Will LRC Reach $0.6 Soon?")
- Bullish Loopring (LRC) price prediction ranges from $0.1290 to $0.6750
- Analysis suggests that the BAND price might reach above $0.5850
- The LRC bearish market price prediction for 2023 is $0.1319
What is Loopring (LRC)?
Loopring is an Ethereum-based, open-source project which builds protocols, infrastructure, and user-facing products for the future of finance while LRC is the Ethereum-based cryptocurrency token of Loopring.
Envisioning the future being built on Ethereum, and, specifically on layer 2 Zero-Knowledge Rollups (zkRollups), Loopring, Ethereum’s First zkRollup Layer2 was launched in 2017. LRC tokens became available to the public during an initial coin offering (ICO) in August 2017, while the Loopring protocol was first deployed on the Ethereum mainnet in December 2019.
Loopring is a main product of an ambitious attempt to take advantage of the benefits of centralized and decentralized exchanges while eliminating the inefficacies involved in both types of exchanges.
As such, Loopring has succeeded in proving that non-custodial technology can replicate custodial alternatives in speed, cost, and experience. Moreover, they have made DEXes as performant as CEXes and will outcompete incumbent fintech.
Table of contents
- What is Loopring (LRC)?
- Loopring (LRC) Market Overview
- Analysts’ Views on Loopring (LRC)
- Loopring (LRC) Current Market Status
- Loopring (LRC) Price Analysis 2023
- Loopring (LRC) Price Prediction 2023-2030 Overview
- Loopring (LRC) Price Prediction 2023
- Loopring (LRC) Price Prediction 2024
- Loopring (LRC) Price Prediction 2025
- Loopring (LRC) Price Prediction 2026
- Loopring (LRC) Price Prediction 2027
- Loopring (LRC) Price Prediction 2028
- Loopring (LRC) Price Prediction 2029
- Loopring (LRC) Price Prediction 2030
- Loopring (LRC) Price Prediction 2040
- Loopring (LRC) Price Prediction 2050
- Conclusion
- FAQ
- More Crypto Price Predictions:
Loopring (LRC) Market Overview
| 🪙 Name | Loopring |
| 💱 Symbol | LRC |
| 🏅 Rank | #662 |
| 💲 Price | $0.016628068265475 |
| 📊 Price Change (1h) | 1.22 % |
| 📊 Price Change (24h) | 21.21 % |
| 📊 Price Change (7d) | 49.91 % |
| 💵 Market Cap | $22753964.986021 |
| 💸 Circulating Supply | 1368406998.5006 LRC |
| 💰 Total Supply | 1373873397.4425 LRC |
Loopring (LRC) is currently trading at $0.016628068265475 and sits at number #662 on CoinMarketCap in terms of market capitalization. There are 1368406998.5006 LRC coins currently in circulation, bringing the total market cap to $22753964.986021.
Over the past 24 hours, Loopring has increased by 21.21%. Looking at the last week, the coin is up by 49.91%.
Analysts’ Views on Loopring (LRC)
IncomeSharks, a crypto education and market analysis platform stated that LRC was seeming to form an Adam and Eve bottom and that there were many good upsides to it.
Loopring (LRC) Current Market Status
Loopring (LRC) has a circulating supply of 1,331,430,935 LRC coins, while its maximum supply is 1,374,513,896 LRC coins, according to CoinMarketCap. At the time of writing, LRC is trading at $0.2973 representing 24 hours increase of 1.12%. The trading volume of LRC in the past 24 hours is $12,142,996 which represents a 26.04% decrease.
Some top cryptocurrency exchanges for trading BAND are Coinbase Pro, Bilaxy, OKEx, and Binance.
Now that you know LRC and its current market status, we shall discuss the price analysis of LRC for 2023.
Loopring (LRC) Price Analysis 2023
Loopring (LRC) Price Analysis – Bollinger Bands
The Bollinger bands are a type of price envelope developed by John Bollinger. It gives a range with an upper and lower limit for the price to fluctuate. The Bollinger bands work on the principle of standard deviation and period (time).
The upper band as shown in the chart is calculated by adding two times the standard deviation to the Simple Moving Average while the lower band is calculated by subtracting two times the standard deviation from the Simple Moving Average. When the bands widen, it shows there’s going to be more volatility and when they contract, there is less volatility.
Disclaimer: The views and opinions, as well as all the information shared in this price prediction, are published in good faith. Readers must do their own research and due diligence. Any action taken by the reader is strictly at their own risk. Coin Edition and its affiliates will not be held liable for any direct or indirect damage or loss.
When Bollinger bands are used in a cryptocurrency chart, we could expect the price of the cryptocurrency to reside within the upper and lower bounds of the Bollinger bands 95% of the time. The above thesis is derived from an Empirical law.
The sections highlighted by red rectangles in the chart above show how the bands expand and contract. When the bands widen, we could expect more volatility, and when the bands contract, it denotes less volatility.
The green rectangles show how LRC retraced after touching the upper band (overbought) and lower band (oversold).
Currently, the Bollinger bands are moving downward while maintaining a constant space in between them. LRC is retracing closer to the Simple Moving Average after bouncing off of the lower band.
As Loopring is on the rise after touching the lower Bollinger band it could go above the SMA and fluctuate in the first half of the Bollinger bands. Interestingly, this surge is emitting symptoms of the surge that LRC had during the beginning of 2023.
On both occasions highlighted in the chart, we could see the bands going lower while maintaining a constant space in between them. Thereafter, we see the band shrink and then the surge happened. Hence, this could be the early sign of LRC reciprocating its past behavior. If that is the case, then those looking to go may consider entering the market before the surge happens.
However, it would be advisable if they wait for the formation of some more candlesticks before entering the market. But this would mean that they would enter the market quarter-way or mid-way through the surge. In that case, if traders are looking to make use of the whole surge then they would need to use different indicators or a combination of indicators to get concrete evidence about an impending surge.
Nonetheless, when considering the past scenarios, we could see that LRC encountered selling pressure when close to the SMA. The recent rejection is one such classic example. Hence, this could be another rejection. As such, buyers may want to do their due diligence before entering the market.
Loopring (LRC) Price Analysis – Relative Strength Index
The Relative Strength Index is an indicator that is used to find out whether the price of a security is overvalued or undervalued. As per its name, RSI indicators help determine how the security is doing at present, relative to its previous price.
Moreover, it has a signal line which is a Simple Moving Average (SMA) that acts as a yardstick or reference to the RSI line. Hence, whenever the RSI line is above the SMA, it is considered bullish; if it’s below the SMA, it is bearish.
When considering the first green rectangle from the left of the chart below we can see that the RSI is above the signal. Hence, LCR is bullish and as a result, it is making higher highs.
The second green rectangle shows that the RSI line (purple) is below the Signal line (yellow). As such, LCR is bearish or losing value. Therefore it is reaching lower lows as shown in the chart.
Currently, the RSI of LRC is at 42.45 and it is tilting upwards. Notably, LRC is approaching the 44.32 region for the second time. This is because its motion toward the upwards direction was barred by 44.32 whereupon RSI ricocheted off of it. However, if LRC happens to cross the 50 mark on the RSI indicator, then, we could call the trend strong.
As such, those waiting to enter a long position may need to wait for the RSI to cross the 44.32 region as LRC has the tendency to ricochet off of that region.
Moreover, the RSI could also be used to find out the divergence. For instance, when the token is making higher highs then the RSI should also be making higher highs in unison with it for it to be called a bull run. However, if the RSI does not make higher highs with the token, then we could say that there could be a trend reversal, as the token is losing value despite making higher highs.
Loopring (LRC) Price Analysis – Moving Average
The Exponential Moving averages are quite similar to the simple moving averages (SMA). However, the SMA equally distributes down all values whereas the Exponential Moving Average gives more weightage to the current prices. Since SMA undermines the weightage of the present price, the EMA is used in price movements.
The 200-day MA is considered to be the long-term moving average while the 50-day MA is considered the short-term moving average in trading. Based on how these two lines behave, the strength of the cryptocurrency or the trend can be determined on average.
In particular, when the short-term moving average (50-day MA) approaches the long-term moving average (200-day MA) from below and crosses it, we call it a Golden Cross.
Contrastingly, when the short-term moving average crosses the long-term moving average from above then, a death cross occurs.
Usually, when a Golden Cross occurs, the prices of the cryptocurrency will shoot up drastically, but when there’s a Death Cross, the prices will crash.
Whenever the price of cryptocurrency is above the 50-day or 200-day MA, or above both we may say that the token is bullish (Red rectangle). Contrastingly, if the token is below the 50-day or 200-day, or below both, then we could call it bearish (Blue triangle section).
When comparing the surge that LRC went through at the beginning of 2023 with what’s happenings currently, it seems like LRC is gearing up for another surge. Nonetheless, it has been rejected once again at the 200-Day MA. As such, it may seek support at the yellow horizontal line at $0.2772, once again before the surge.
In the event that the preceding happens, then the yellow horizontal line could serve as an excellent entry point for buyers.
Loopring (LRC) Price Analysis – Rate of Change
The Rate of Change Indicator is a momentum oscillator, that measures the change of the current price against the past price a few (n) periods ago, in percentage. As long as the price is rising ROC will be positive. But, the ROC indicator will reach the negative zone when the prices reduce. Increasing values in either direction, positive or negative, indicate increasing momentum, and moving back toward zero indicates diminishing momentum.
Unlike the RSI, ROC has no set overbought or oversold regions, it rather depends on a trader’s discretion. Traders often tend to find the areas in the positive and negative zones where the trend changes have happened in regularity. Based on this they could mark their bounds for overbought and oversold regions.
ROC could also be used as a divergence indicator that signals a possible upcoming trend change. Divergence occurs when the price of a stock or asset moves in one direction while its ROC moves in the opposite direction.
For example, suppose a stock’s price is rising over a period of time and registering higher highs while the ROC is progressively moving lower, or making lower highs. In that case, the ROC is indicating bearish divergence from price, which signals a possible trend change to the downside. The chart shows an example of the above scenario. The same concept applies if the price is moving down and ROC is moving higher.
Additionally, the zero line crossover could be used to signal trend changes. However, depending on the number used for n (periods) in the indicator the signals may come in early or late.
LRC’s extremely overbought regions are marked as Overbought Region 1 at 34.32, and Overbought Region 2 at 78.07. Meanwhile, LRC’s Oversold Regions are marked as Oversold Region 1 at -20.86, and Oversold Region 2 at -31.32,
Currently, the ROC indicates a value of -18.33. and the line is heading toward the Oversold Region at $-20.86. There could be trend reversal at this point, since, this region is a familiar region where LRC reversed. As there is a probability of LRC reversing at this point, buyers should be on the lookout for a reversal here.
Notably, on every occasion the ROC of LRC reached the Oversold Region 1 after recovering from the Oversold Region 2, the chart shows that the ROC has been moving towards the zero line. As such, buyers should time the market and enter in the nick of time. They may want to use an indicator that shows the selling and buying volume.
Loopring (LRC) Price Prediction 2023-2030 Overview
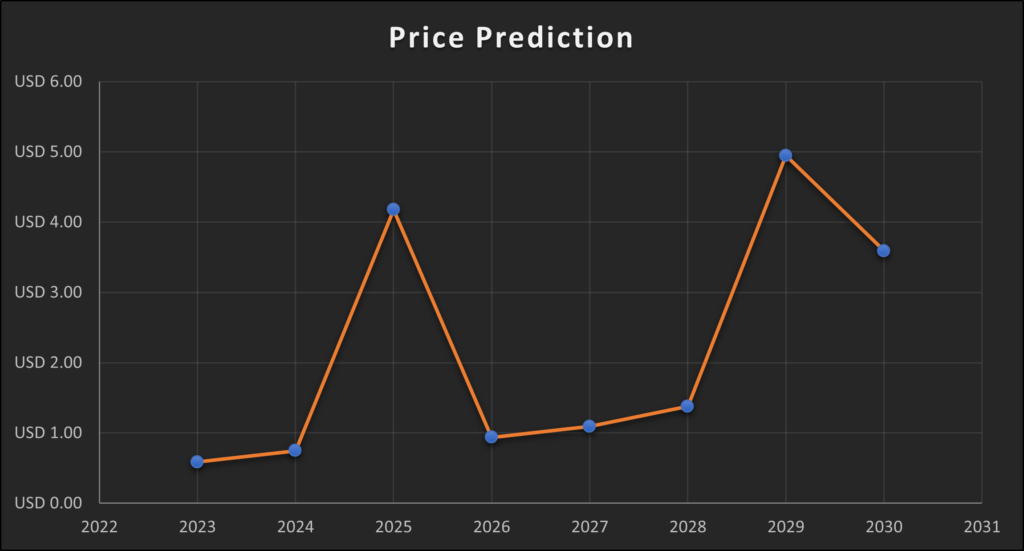
| Year | Minimum Price | Average Price | Maximum Price |
| 2023 | $0.3854 | $0.585 | $0.6201 |
| 2024 | $0.691 | $0.7471 | $0.8920 |
| 2025 | $3.912 | $4.177 | $4.911 |
| 2026 | $0.7982 | $0.9361 | $1.0012 |
| 2027 | $1.0822 | $1.0938 | $1.250 |
| 2028 | $1.287 | $1.3775 | $1.546 |
| 2029 | $3.598 | $4.9474 | $5.268 |
| 2030 | $2.891 | $3.5891 | $3.781 |
| 2040 | $6.854 | $7.289 | $7.9852 |
| 2050 | $8.255 | $10.7307 | $11.982 |
Loopring (LRC) Price Prediction 2023
When considering the fluctuation of LRC, we could see that it has been forming the symmetrical triangle. There is a possibility of LRC breaking in either direction. If LRC breaks out of the symmetrical triangle in the upwards direction, we could expect it to reach somewhere close to Resistance 2 at $ 0.5850. However, this surge would not come without any resistance at Resistance 1 at $0.4650.
Contrastingly, if LRC breaks down from the symmetrical triangle, we could expect the prices to reach Support 2 at $0.2. When it reaches this point, buyers should be vigilant, as there lies a probability of LRC surging to Resistance 1 from this position, based on its historic behavior.
However, if Support 1 does not hold LRC from falling, then, we could expect LRC to reach Support 2 at $0.1319.
Importantly when traders may want to set their take profit with the difference between the earliest highest price and earliest lowest price. And their stop loss could be just below the entry point.
Loopring (LRC) Price Prediction – Resistance and Support Levels
When looking at the chart above, we could see that LRC was above the 45-degree angle for a brief period of time before it dropped. It sorted for support at 3:1 and started increasing along that Gann line. However, this increment too was dismantled by the bears as LRC tanked further.
November 2021 brought about a great surge, where the LRC rose vertically reaching above 1:1 (45 ordinal number). Soon after this shorted stayed surge, LRC descended searching for support at the 8:1 line, 4:1 line, 3:1 line, and 2:1 line on the Gann fan.
Nonetheless, the 2:1 Gann line could hold LRC for a long time. As such, LRC fell below that line too, and ever since it fell it has been testing the 2:1 Gann line but never was able to break it even once.
Loopring (LRC) Price Prediction 2024
There will be Bitcoin halving in 2024, and hence we should expect a positive trend in the market due to user sentiments and the quest by investors to accumulate more of the coin. However, the year of BTC halving hasn’t been a prosperous year for LRC based on the previous halving. Hence, we could expect LRC to trade at a price not below $0.7471 by the end of 2024.
Loopring (LRC) Price Prediction 2025
LRC may experience the after-effects of the Bitcoin halving and is expected to trade much higher than its 2024 price. Many trade analysts speculate that BTC halving could create a huge impact on the crypto market. Moreover, similar to many altcoins, LRC will continue to rise in 2025 forming new resistance levels. It is expected that LRC would trade beyond the $4.177 level.
Loopring (LRC) Price Prediction 2026
It is expected that after a long period of bull run, the bears would come into power and start negatively impacting the cryptocurrencies. During this bearish sentiment, LRC could tumble into its support regions. During this period of price correction, LRC could lose momentum and be way below its 2025 price. As such it could be trading at $0.9361 by 2026.
Loopring (LRC) Price Prediction 2027
Naturally, traders expect a bullish market sentiment after the crypto industry was affected negatively by the bears’ claw. Moreover, the build-up to the next Bitcoin halving in 2028 could evoke excitement in traders. However, there will be a dip before LRC actually surges, as such we could expect LRC to trade at around $1.0938 by the end of 2027.
Loopring (LRC) Price Prediction 2028
As the crypto community’s hope will be re-ignited looking forward to Bitcoin halving like many altcoins, LRC may reciprocate its past behavior during the BTC halving. Hence, LRC would be trading at $1.3775 after experiencing a massive surge by the end of 2028.
Loopring (LRC) Price Prediction 2029
2029 is expected to be another bull run due to the aftermath of the BTC halving. However, traders speculate that the crypto market would gradually become stable by this year. In tandem with the stable market sentiment LRC could be trading at $4.9474 by the end of 2029.
Loopring (LRC) Price Prediction 2030
After witnessing a bullish run in the market, LRC and many altcoins would show signs of consolidation and might trade sideways and move downwards for some time while experiencing minor spikes. Therefore, by the end of 2030, LRC could be trading at $3.589
Loopring (LRC) Price Prediction 2040
The long-term forecast for LRC indicates that this altcoin could reach a new all-time high(ATH). This would be one of the key moments as HODLERS may expect to sell some of their tokens at the ATH point.
If they start selling then LRC could fall in value. It is expected that the average price of LRC could reach $7.289 by 2040.
Loopring (LRC) Price Prediction 2050
The community believes that there will be widespread adoption of cryptocurrencies, which could maintain gradual bullish gains. By the end of 2050, if the bullish momentum is maintained, LRC could hit $10.730.
Conclusion
If investors continue to show interest in LRC and add these tokens to their portfolio, then, it could continue to rise up. LRC’s bullish price prediction shows that it could reach $0.585 level.
FAQ
Loopring is an Ethereum-based, open-source project which builds protocols, infrastructure, and user-facing products for the future of finance.
LRC can be traded on many exchanges like Binance, CoinW, OKX, BTCEX, and Deepcoin.
LRC has a possibility of surpassing its present all-time high (ATH) price of $3.8272 in 2021.
LRC is one of the few cryptocurrencies that has been consolidating for the past year. As such, we could expect it to burst out with a large spike. If it does spike it might reach $0.585 soon after its breaks the Resistance 1 level.
LRC has been one of the most suitable investments in the crypto space. Although it has been consolidating during the past, we could expect it to rise exponentially when the bottom is reached. Hence, traders may be allured to invest in LRC.
The present all-time low price of LRC is $0.01986.
Daniel Wang, a software engineer and entrepreneur is the founder of Loopring.
The maximum supply of Loopring is 1,374,513,896 LRC coins.
LRC can be stored in a cold wallet, hot wallet, or exchange wallet.
LRC is expected to reach $0.585 by 2023.
LRC is expected to reach $0.7471 by 2024.
LRC is expected to reach $4.1777 by 2025.
LRC is expected to reach $0.9361 by 2026.
LRC is expected to reach $1.0938 by 2027.
LRC is expected to reach $1.3775 by 2028.
LRC is expected to reach $4.9474 by 2029.
LRC is expected to reach $3.5898 by 2030.
LRC is expected to reach $7.2890 by 2040.
LRC is expected to reach $10.730 by 2050.
Disclaimer: The views and opinions, as well as all the information shared in this price prediction, are published in good faith. Readers must do their research and due diligence. Any action taken by the reader is strictly at their own risk. Coin Edition and its affiliates will not be held liable for any direct or indirect damage or loss.
More Crypto Price Predictions:
- Neo (NEO) Price Prediction 2023-2030
- Mina (MINA) Price Prediction 2023-2030
- Ethernity (ERN) Price Prediction 2023-2030
- Ravencoin (RVN) Price Prediction 2023-2030
- Spell Token (SPELL) Price Prediction 2023-2030
Disclaimer: The information presented in this article is for informational and educational purposes only. The article does not constitute financial advice or advice of any kind. Coin Edition is not responsible for any losses incurred as a result of the utilization of content, products, or services mentioned. Readers are advised to exercise caution before taking any action related to the company.

: What Happens If You Use an Unlicensed Platform?")


