


- MKR experienced high accumulation since the Maker’s founder sold other tokens to buy MKR.
- Increasing RSI and decreasing volume could lead MKR into consolidation.
- The direction strength was weak, prompting a possibility to fall back to $950.
Maker’s (MKR) performance in the last 24 hours has been worthwhile for traders who open long positions. In the early hours of July 18, MKR exchanged hands around $903. But according to CoinMarketCap, a 7.53 % hike, coupled with a surge in volume, drove the token to $978.33.
For some, MKR’s rise might not be surprising. This is because MakerDAO founder Rune Christensen sold some of the protocol’s stablecoin DAI to purchase MKR on July 16. A day after his action, Christensen then turned to Lido DAO Token (LDO) and sold 13.57 million of the token to buy MKR.
Usually, this sort of large accumulation is characterized by a rise in value. Hence, it was only expected that the buying pressure causes an upward trajectory for MKR.
MKR Risks Retracement
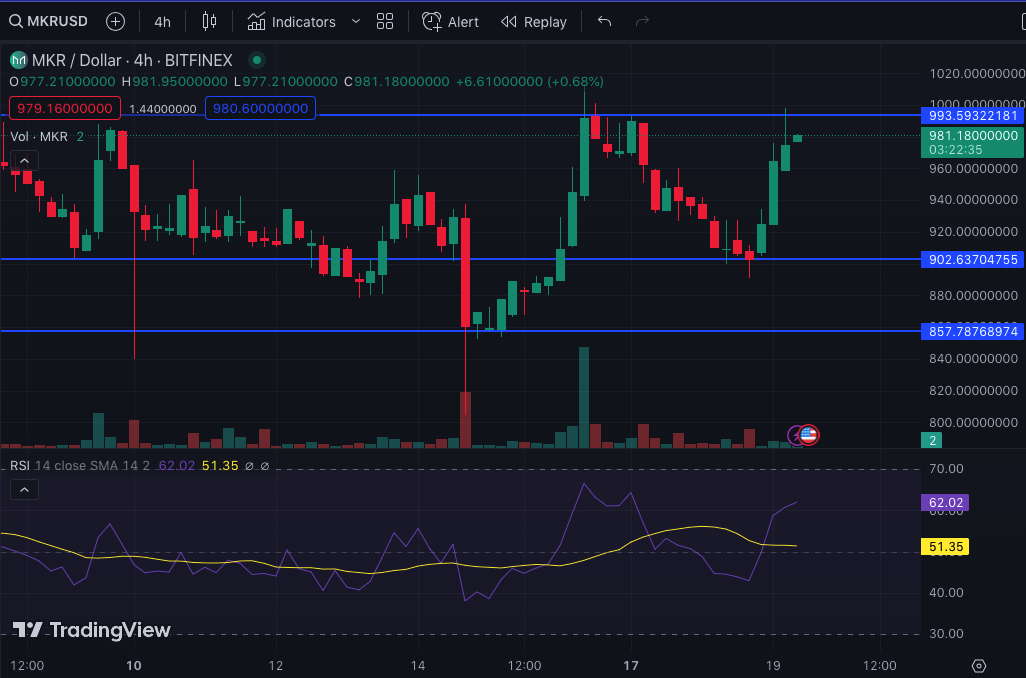
By looking at the 4-hour MKR/USD chart, this was not the first time in recent times that MKR’s buying pressure has been high. On July 15, solid demand appeared at $857.78. This led to a tremendous increase to $993.59 the day after.
However, the rally ended with widespread profit-taking such that MKR almost lost hold on the $900 threshold. As per its upward and downward movement between July 15 and 16, MKR could again be at risk of retracement.
One reason for this is the Relative Strength Index (RSI) and volume. At the time of writing, the RSI was 62.02— a confirmation that buyers were in control. But the impressive buying momentum was accompanied by decreasing volume.
Therefore the bullish divergence could be neutralized. If the trend continues, the RSI could fall and oscillate around the 50% center-line. Consequently, MKR’s upward trajectory could come to a halt, and the price could drawback to $950.
No Directional Backing
Also, the Directional Movement Index (DMI) aligned with the buying pressure presence. At press time, the +DMI (blue) was 31.79, implying that buy orders were much.
The sell side, indicated by the -DMI (red) was 17.10. Despite the wide margin between both indicators, MKR might not hit $1000 soon due to the status of the Average Directional Index (ADX). As of this writing, the ADX (yellow) was 17.55.
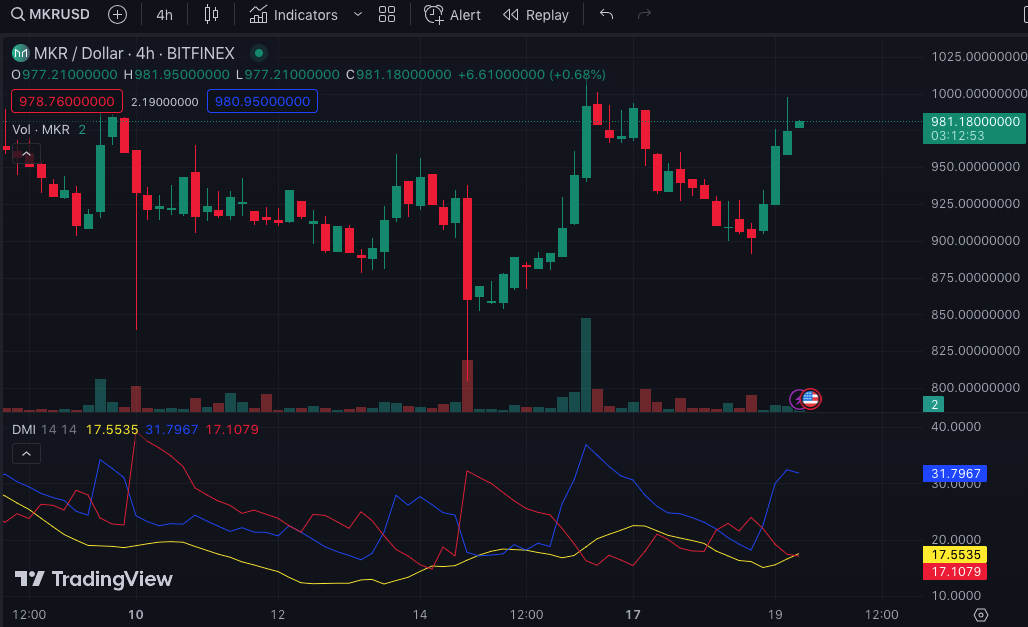
Typically, an asset requires the ADX to have a value of 25 or above to confirm its directional strength. But since MKR did not have the ADX support, then another significant rise in price might be unlikely.
Disclaimer: The views, opinions, and information shared in this price prediction are published in good faith. Readers must do their research and due diligence. Any action taken by the reader is strictly at their own risk. Coin Edition and its affiliates will not be liable for direct or indirect damage or loss
Disclaimer: The information presented in this article is for informational and educational purposes only. The article does not constitute financial advice or advice of any kind. Coin Edition is not responsible for any losses incurred as a result of the utilization of content, products, or services mentioned. Readers are advised to exercise caution before taking any action related to the company.


