

- MMT jumps 51% daily as buyers push price toward the $0.3036 resistance zone.
- Open interest reaches $44.7M, signaling rising trader participation and conviction.
- Spot inflows remain modest, suggesting cautious accumulation despite strong momentum.
Momentum (MMT) has extended its bullish run, gaining investor attention after a sharp breakout pushed the token above technical levels. The token trades around $0.2931 after rising 51.19% over the past 24 hours.
MMT also recorded a 63.98% weekly increase, highlighting strong short-term demand. Besides, trading volume reached $102.6 million as buyers increased their market activity. The current rally reflects renewed confidence as MMT approaches critical resistance zones.
MMT Rally Gains Strength After Breakout
The MMT/USDT four-hour chart shows a powerful recovery from the $0.18 consolidation range. Buyers maintained control and drove prices above major Ichimoku Cloud levels. Consequently, the bullish structure continues to attract attention from traders.
The conversion line stays above the base line, supporting the ongoing upward trend. Moreover, the price now targets the $0.3036 resistance level, which aligns with the 1.0 Fibonacci extension.
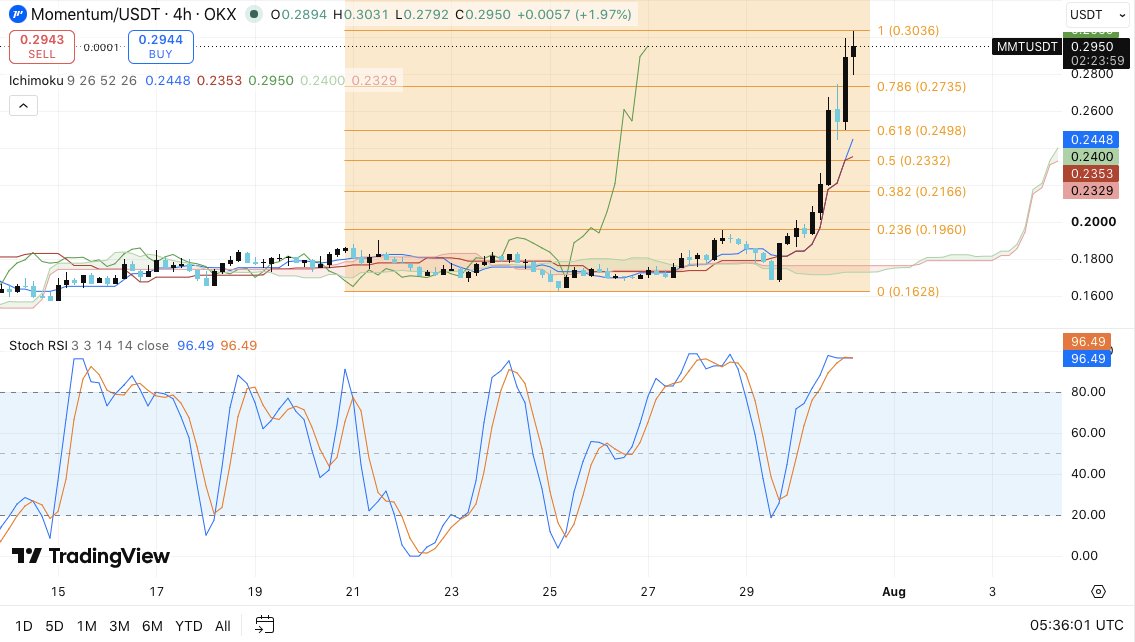
A successful move above $0.3036 could open the path toward the $0.3100 to $0.3200 region. However, traders should monitor short-term risks because momentum appears stretched.
The Stochastic RSI remains above 96, showing strong buying pressure but also signaling overbought conditions. Hence, some investors may secure profits before the next potential advance.
Related: XRP Price Prediction August 2026: Can XRP Break the Yearly Downtrend as Grayscale’s CEO Sells GXRP?
The key support zone sits near $0.2735, which matches the 0.786 Fibonacci retracement level. Additionally, the $0.2498 area provides another important defense for buyers. A deeper correction could bring MMT toward $0.2332 or $0.2166. These levels may determine whether bulls maintain control.
Open Interest Signals Rising Market Participation
MMT derivatives data highlights increasing trader involvement during the recent rally. Open interest climbed sharply after staying between $8 million and $15 million from March through mid-June. Significantly, open interest reached approximately $44.73 million during the final week of July. This increase suggests fresh capital entered the derivatives market alongside the price recovery.
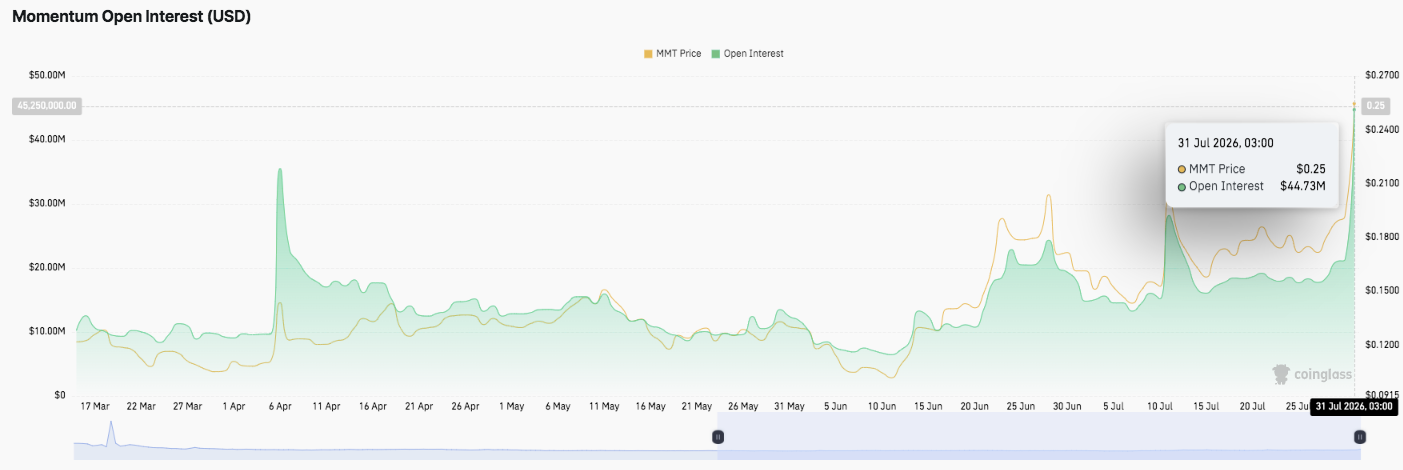
Moreover, the combination of rising price and open interest often reflects stronger market conviction. However, higher leverage can also increase volatility during sudden price movements. Traders should watch whether open interest continues growing with steady price gains.
Spot Flows Show Cautious Accumulation
MMT spot inflow and outflow data shows mixed investor behavior across recent months. Early November recorded major outflow activity before a large inflow spike above $30 million. After that event, netflows remained mostly balanced with limited buying and selling pressure.
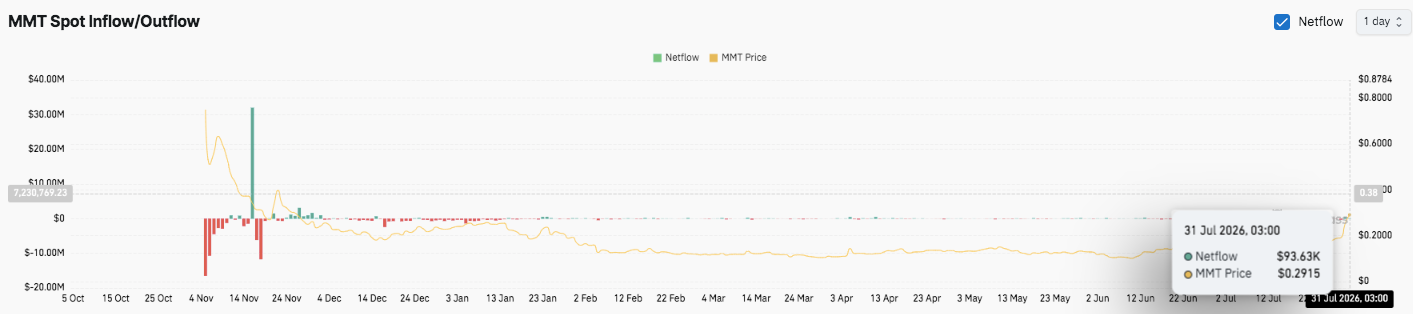
Recently, MMT recorded around $93.6K in net inflows near $0.2915. This suggests cautious accumulation among investors. Nevertheless, stronger and sustained inflows could provide additional support for the next bullish phase.
Technical Outlook For Momentum (MMT)
Momentum (MMT) enters the next trading phase with clearly defined support and resistance zones after its recent breakout rally.
Upside levels: $0.3036 remains the immediate resistance and the key Fibonacci extension level to overcome. A decisive move above this barrier could push MMT toward the $0.3100–$0.3200 range as buyers attempt to extend the current rally.
Downside levels: $0.2735 represents the first major support, followed by $0.2498 and $0.2332 if selling pressure increases. A drop below $0.2166 could weaken the short-term bullish structure and signal a deeper correction.
The technical setup shows MMT trading within a strong bullish trend after breaking above the previous $0.18 consolidation zone. However, momentum indicators suggest the token may face short-term cooling as the Stochastic RSI remains in overbought territory. This condition could trigger profit-taking or sideways movement before the next major breakout attempt.
Will Momentum Price Continue Higher?
Momentum’s price prediction depends on whether buyers can maintain control above the $0.2735 support zone. Holding this level would strengthen the bullish setup and increase the chances of a retest of $0.3036. Additionally, sustained growth in open interest and improving spot inflows could provide further confirmation of renewed market participation.
If MMT breaks above the $0.3036 resistance with strong volume, the token could target the $0.3100–$0.3200 region. However, failure to clear this resistance may result in a healthy pullback toward the $0.2735–$0.2500 support area. For now, Momentum remains positioned at a critical point, where continued capital inflows and technical strength will determine its next major move.
Disclaimer: The information presented in this article is for informational and educational purposes only. The article does not constitute financial advice or advice of any kind. Coin Edition is not responsible for any losses incurred as a result of the utilization of content, products, or services mentioned. Readers are advised to exercise caution before taking any action related to the company.