


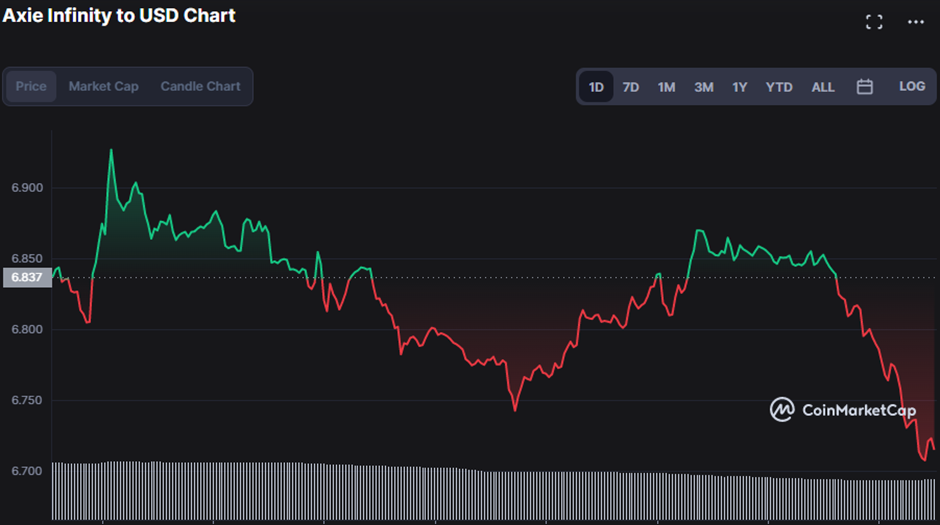
- Bulls have lately outpaced bears, with prices rising by 2.92% to $7.09.
- Technical indicators imply that bulls will continue to dominate the market.
- During the day, the AXS market finds support at $6.70.
The positive trend in the Axie Infinity (AXS) market has resurfaced, and the bulls are back in control. As a consequence of the bullish momentum, the AXS price has risen dramatically to $7.09, representing a 2.92% boost.
The AXS market cap grew by 2.81% to $705,631,385, and the 24-hour trading volume increased by 4.07% to $53,912,992 due to the market outburst.
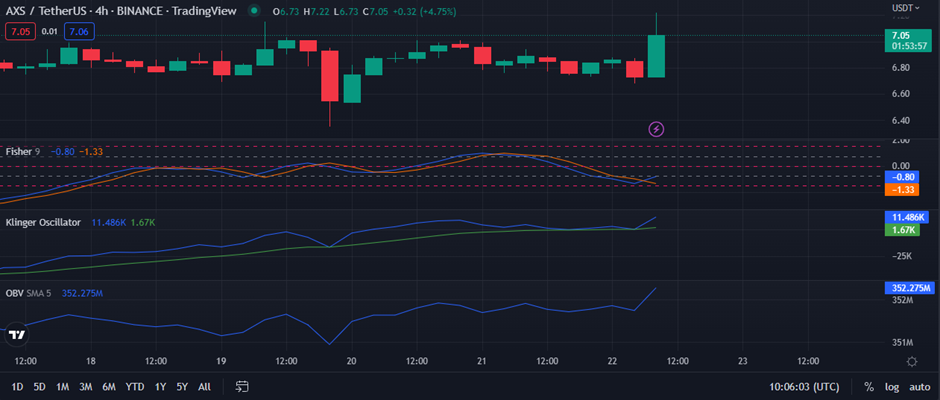
Even if the Fisher Transform trend drops below the zero line into the negative zone, reading -1.74, the bullish trend is still likely to continue since it is now going upwards and is therefore moving out of the negative zone. The signal line’s downward trend below the Fisher transform is also consistent with the growth.
Recently, the Klinger Oscillator has risen above its 100-period simple moving average line, indicating that bullish momentum is likely to persist. The change is seen on the 4-hour price chart, which now displays two sets of positive numbers (11,448K and 1.664K, respectively). A purchase signal is generated when the Klinger line crosses above the signal line, indicating that the downward trend is losing momentum.
Longer peaks and troughs in On-Balance-Volume (OBV) and price suggest that the upswing will persist. The rising OBV line (now 351.764M) is another positive indication for traders, as it suggests that buying pressure is developing, and a breakout may soon occur.
A golden cross (bullish crossover) is displayed on the AXS price chart when the short term MA crosses above the long-term MA. The 5-day MA is at 7.08 and the 20-day MA is at 6.85. The formation of a green engulfing candlestick pattern adds to this optimistic trend. Further adding to this bullish outlook can be seen due to the price action towards the short-term MA.
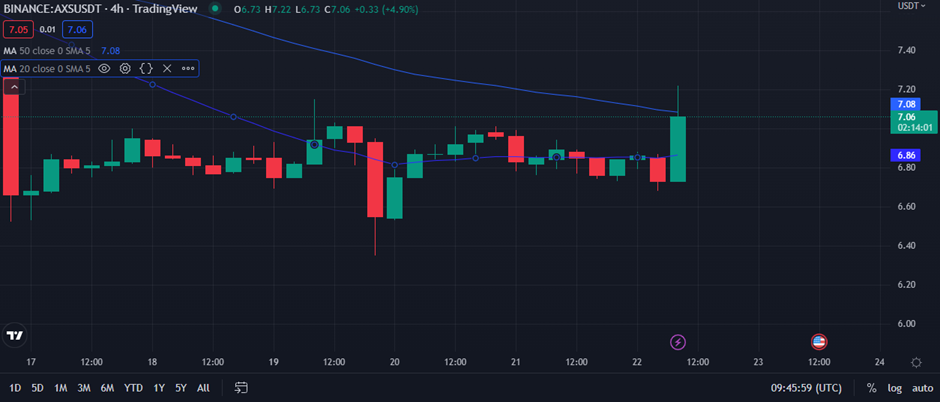
If the current uptrend in the AXS market is to continue, bulls will have to work hard to defend the resistance level and keep prices above water.
Disclaimer: The views and opinions, as well as all the information shared in this price analysis, are published in good faith. Readers must do their own research and due diligence. Any action taken by the reader is strictly at their own risk, and Coin Edition and its affiliates will not be held liable for any direct or indirect damage or loss.
Disclaimer: The information presented in this article is for informational and educational purposes only. The article does not constitute financial advice or advice of any kind. Coin Edition is not responsible for any losses incurred as a result of the utilization of content, products, or services mentioned. Readers are advised to exercise caution before taking any action related to the company.
 Price Prediction 2026, 2027, 2028, 2029, 2030-2050")
 Price Prediction 2026, 2027, 2028, 2029, 2030-2050")


