


- Data platform Santiment revealed in a tweet today that Ethereum’s network growth has been on the rise over the past few weeks.
- According to the analytics firm, ETH’s network growth is at a 4-month high.
- Technical indicators suggested that ETH may drop to $1,777.83 in the coming 24-48 hours.
The blockchain analytics platform Santiment revealed in a tweet earlier today that network growth for Ethereum (ETH) has been on the rise over the past few weeks. According to the post, new addresses are being created on the blockchain at an increased pace, which may be a signal of eventual market cap growth.
The firm also noted that Ethereum’s network growth is at its highest level in 4 months. Santiment referred to this increase in new addresses as a bullish divergence, given that ETH’s price struggled to overcome the $2K resistance level during the same time period.
At press time, CoinMarketCap indicated that the altcoin leader’s price stood at $1,860.96 after it printed a 3.06% gain over the past 24 hours. This negative daily performance succeeded in pushing ETH’s weekly performance into the red as well. As a result, the crypto was down 1.36% over the past 7 days.
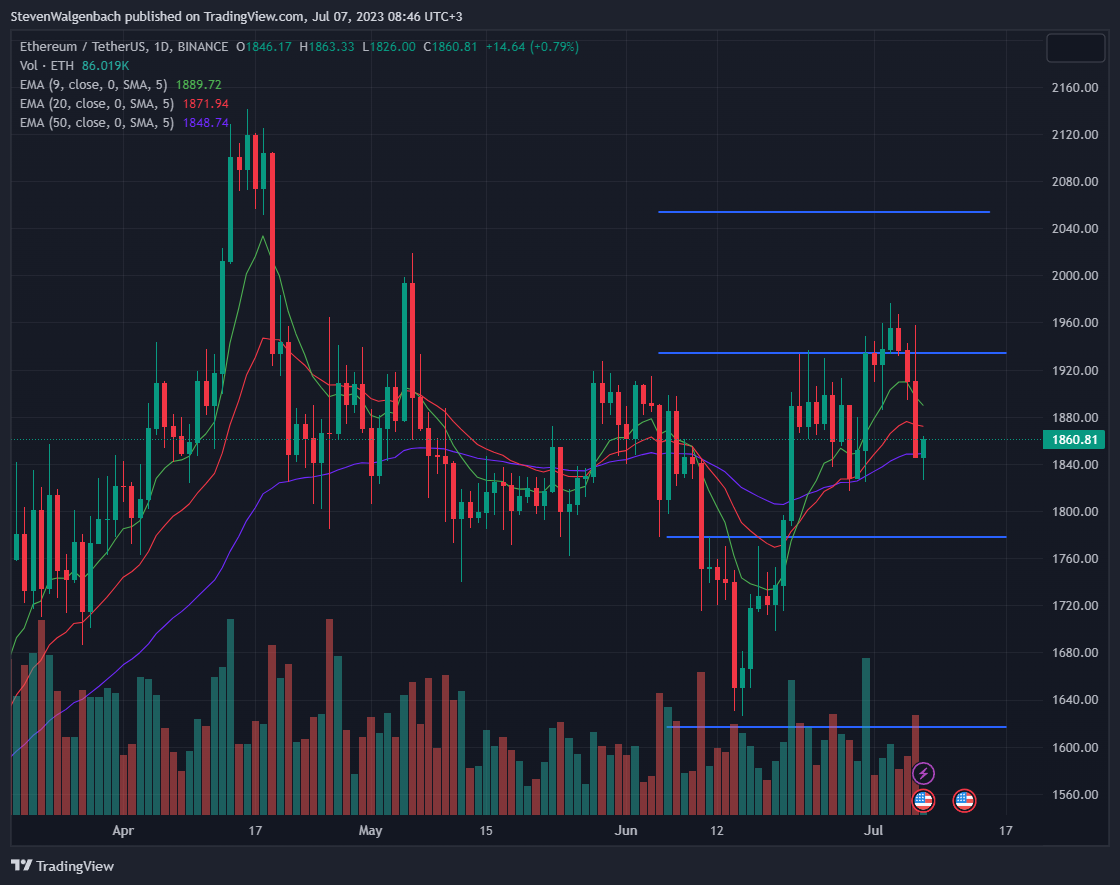
Looking at ETH’s daily chart, the altcoin’s price dropped below the crucial 50-day EMA line over the past 24 hours to reach a low of $1,826.00. Bulls did, however, give ETH a much-needed boost for it to trade above the technical indicator at press time.
Nevertheless, ETH’s price remained at risk of dropping to the next major support level at $1,777.83 in the coming 24-48 hours. A confirmation of this bearish thesis will be if the altcoin’s price drops below the 50-day EMA line again.
On the other hand, if ETH’s price is able to close a daily candle above the 20-day EMA line in the following 48 hours, then it may look to retest the resistance level at $1,900 in the next few days. Investors and traders will want to monitor the 9-day and 20-day EMA lines, however, as the two technical indicators were looking to cross.
Should the 9-day EMA line cross below the 20-day EMA line, it will signal that ETH has entered into a short-term bearish cycle. This will, therefore, invalidate the bullish thesis and the crypto may drop to the aforementioned $1,777.83 mark.
Disclaimer: The views and opinions, as well as all the information shared in this price analysis, are published in good faith. Readers must do their own research and due diligence. Any action taken by the reader is strictly at their own risk. Coin Edition and its affiliates will not be held liable for any direct or indirect damage or loss.
Disclaimer: The information presented in this article is for informational and educational purposes only. The article does not constitute financial advice or advice of any kind. Coin Edition is not responsible for any losses incurred as a result of the utilization of content, products, or services mentioned. Readers are advised to exercise caution before taking any action related to the company.


