

- OKB trades at $93.01 on August 8, up 3.43%, breaking above a multi-week consolidation range with volume surging 110.52% to $39.48M
- Spot netflow turned positive at $120.23K on August 8 after heavy exchange inflows the prior session, signaling accumulation rather than distribution
- Analyst Nehal flagged OKB as ready for a breakout, with a reclaim of $93 to $95 targeting $110 and $124, roughly 33% upside from current levels
The OKB price prediction turned bullish this week after token breaking cleanly above the $82 to $87 range it had been stuck in for weeks as altcoin rotation accelerates and volume more than doubles overnight.
OKB Price Analysis: Range Breakout Confirmed With Hourly RSI in Overbought Territory
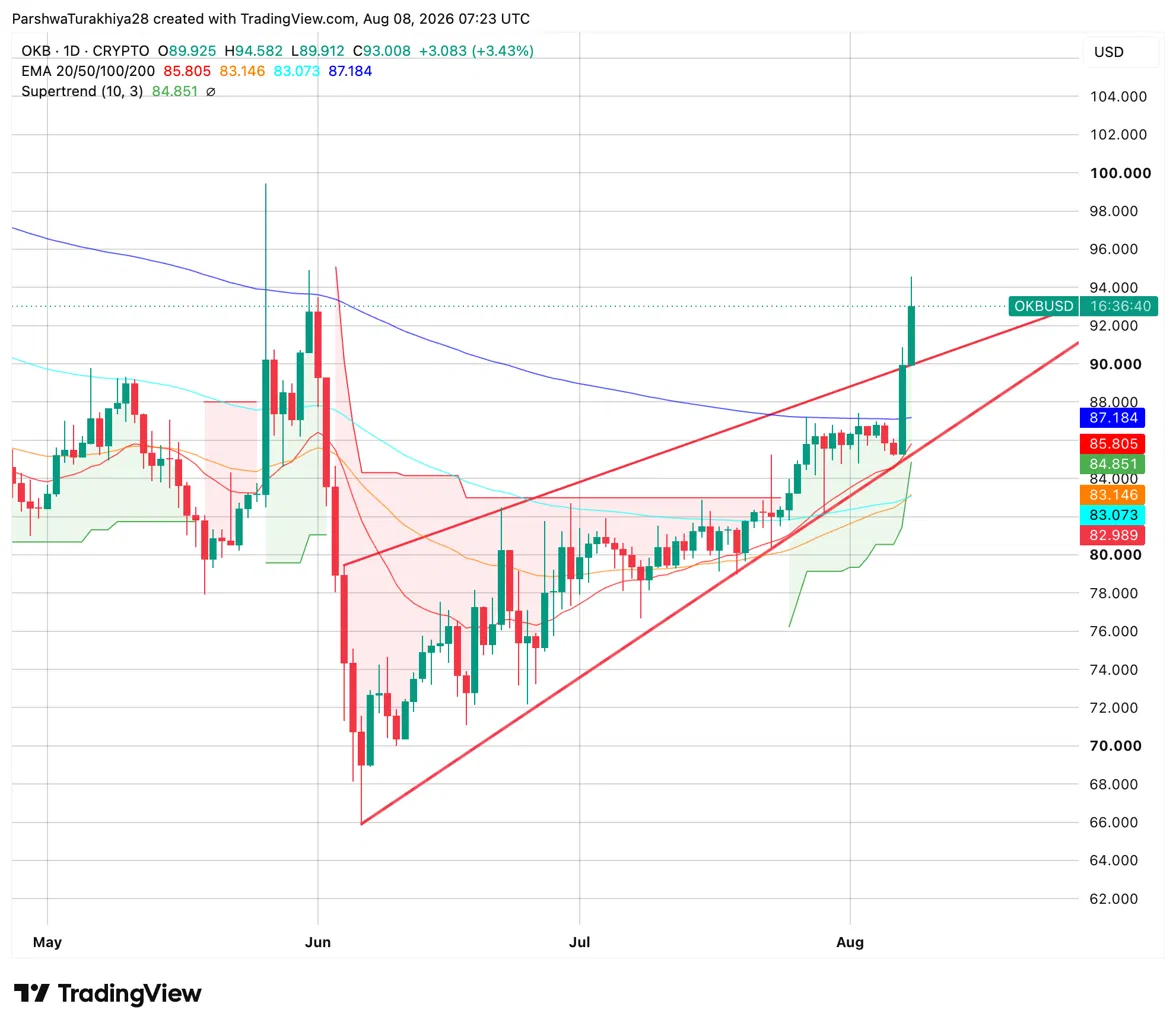
The daily chart shows OKB completing a textbook ascending triangle breakout. Price had been compressing between a rising lower trendline from the June lows and flat resistance near $87 since July. Today’s session opened at $89.93, pushed to $94.58, and is holding at $93.01, clearing the resistance zone and all four EMAs in a single candle.
The 20-day EMA at $85.81 and Supertrend at $84.85 both sit well below current price and now serve as the first support zone on any pullback. The 50-day at $83.15, 100-day at $83.07, and 200-day at $87.18 are all below, confirming the EMA stack is fully bullish for the first time since May.
Analyst Nehal flagged the $93 to $95 zone as the key reclaim level, with targets at $110 and $124 if that holds on a daily close.
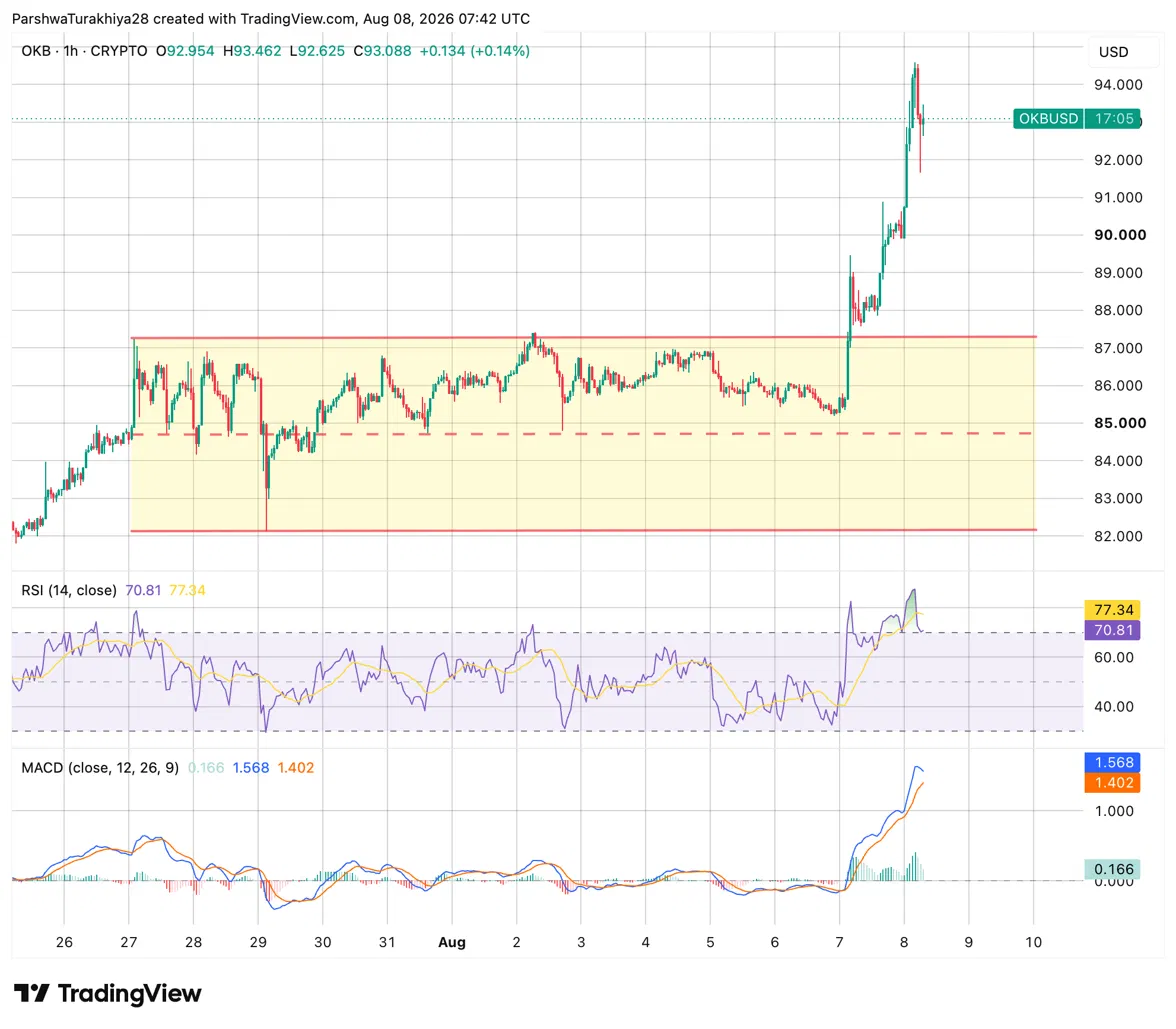
The hourly chart adds more nuance. OKB had been trading in a tight $82 to $87 range for over a week before the breakout candle arrived. Hourly RSI at 70.81 has entered overbought territory and MACD at 1.568 is elevated but still positive, suggesting momentum is strong but a short-term cooling is possible before the next leg.
OKB Support and Resistance Levels, August 8, 2026
| Type | Price | Level |
| Resistance | $94.58 | Session high, immediate ceiling |
| Resistance | $110 | Analyst Nehal first target |
| Resistance | $124 | Analyst Nehal second target |
| Support | $87.18 | 200-day EMA, prior range resistance now support |
| Support | $85.81 | 20-day EMA |
| Support | $84.85 | Supertrend, bullish below price |
| Support | $82 | Range lower boundary, last major floor |
OKB News: Altcoin Rotation Drives the Move as BTC Stays Flat
Per Liquid State’s August 7 analysis, the broader setup driving OKB’s move is a textbook altcoin rotation. BTC perpetual funding remains flat at around +0.0063%, low enough to signal no extreme leverage build-up but also not strong enough to pull liquidity back into Bitcoin.
With the Fear and Greed index sitting at 29, panic selling has largely exhausted itself, creating a tactical vacuum that capital is filling by rotating into altcoins with tangible catalysts.
Liquid State noted OKB’s 66 Galaxy Score and 49% positive sentiment actually represent a favorable setup for institutional traders: price moving on supply and demand mechanics rather than retail hype. An AltRank of 22 places OKB in the top 25 by composite strength, tying relative momentum to fundamentals rather than narrative alone.
OKB Spot Netflow: Inflows Yesterday, Positive Netflow Today
OKB spot netflow registered $120.23K positive on August 8, meaning more OKB moved off exchanges than onto them. This follows a heavy exchange inflow session on August 7 that briefly exceeded $2M, the highest reading in months.
When large exchange inflows are followed by a price breakout and netflow turning positive the next day, it typically suggests the prior session’s inflows were accumulation rather than distribution, with buyers loading up before the move rather than sellers offloading into strength.
OKB Derivatives: Volume Doubles as Open Interest Builds
Volume surged 110.52% to $39.48M while open interest rose 19.24% to $24.93M. Both rising together confirms fresh money entering rather than existing positions rotating. The overall long/short ratio of 0.9944 is nearly balanced, while OKX accounts lean long at 2.25.
Liquidations over 24 hours totaled $50.26K, with shorts absorbing $49.74K against just $525.68 for longs, a heavily one-sided squeeze confirming the breakout caught short sellers completely offside.
| Metric | Value | Interpretation |
| 24h Volume | $39.48M (+110.52%) | Fresh money entering on the breakout |
| Open Interest | $24.93M (+19.24%) | New positions being added |
| Long/Short Ratio (24h) | 0.9944 | Broadly balanced |
| OKX L/S (Accounts) | 2.25 | OKX accounts skew long |
| 24h Liquidations | $50.26K | Shorts absorbed nearly all the pain |
OKB Price Prediction: Upside and Downside Targets
Bullish Case, Target: $110 (Analyst Target)
OKB holds above the $93 to $95 reclaim zone on a daily close, confirming the breakout is valid. Hourly RSI cools from overbought without a major price pullback, and the broader altcoin rotation continues as BTC funding stays flat. Spot netflow stays positive as buyers accumulate rather than distribute, and price pushes toward analyst Nehal’s first target at $110 with $124 as the extended goal.
Bearish Case, Risk Level: $85.81 (20-day EMA)
The hourly RSI overbought reading resolves lower and OKB loses the $87 former resistance level on a daily close, turning prior resistance back into resistance rather than support. The altcoin rotation reverses as BTC reasserts dominance and liquidity flows back to the largest cap. Price retreats toward the 20-day EMA at $85.81 and the Supertrend at $84.85, where buyers would need to step in to keep the breakout structure intact.
FAQs: OKB Price Prediction
OKB trades at $93.01 after breaking above its $82–$87 range. The bullish target is $110, extending to $124; the bearish risk level is $85.81 (20-day EMA) if the breakout fails.
A combination of a completed ascending triangle pattern, an altcoin rotation as BTC funding stayed flat, and positive spot netflow following heavy exchange inflows the prior session all pointing to fresh accumulation rather than a retail-driven spike.
Analyst Nehal’s targets are $110 and $124 if OKB holds the $93–$95 reclaim zone on a daily close. The $94.58 session high is the immediate ceiling to clear first.
OKB’s breakout is backed by rising volume, positive netflow, and a bullish EMA stack, but hourly RSI is already overbought, which raises the odds of near-term cooling. Weigh the bullish and bearish cases above against your own risk tolerance.
Conclusion
OKB’s breakout checks more boxes than most range breaks do: volume more than doubled, open interest built alongside it, spot netflow flipped positive right after a major inflow session, and the entire EMA stack turned bullish for the first time since May.
That’s a cleaner setup than a typical altcoin pop. The overbought hourly RSI is the one thing standing between here and $110 a quick cooldown that holds the $93–$95 zone keeps the move intact, while a daily close back below $87 would turn today’s breakout level into resistance again and send price back toward the 20-day EMA at $85.81.
Disclaimer: The information presented in this article is for informational and educational purposes only. The article does not constitute financial advice or advice of any kind. Coin Edition is not responsible for any losses incurred as a result of the utilization of content, products, or services mentioned. Readers are advised to exercise caution before taking any action related to the company.