
- MNT trades at $0.4273 on August 8, up 2.20%, breaking a months-long descending trendline with RSI printing a second bullish divergence at 56.83
- Mantle launched its Super Portal on Solana on August 6, secured by Chainlink CCIP, opening Mantle’s capital markets infrastructure to Solana’s liquidity
- August averages +9.27% historically for MNT with 2025 delivering +58.1%, though the median sits at -2.34%
The Mantle price prediction turned technical this week after MNT broke above the descending trendline that’s capped every rally since May, printing a second bullish RSI divergence along the way. The move lines up with the Super Portal going live on Solana, secured by Chainlink CCIP, giving Mantle’s capital markets infrastructure reach into a new ecosystem for the first time.
Mantle Price Analysis: Trendline Break With Double Bullish RSI Divergence
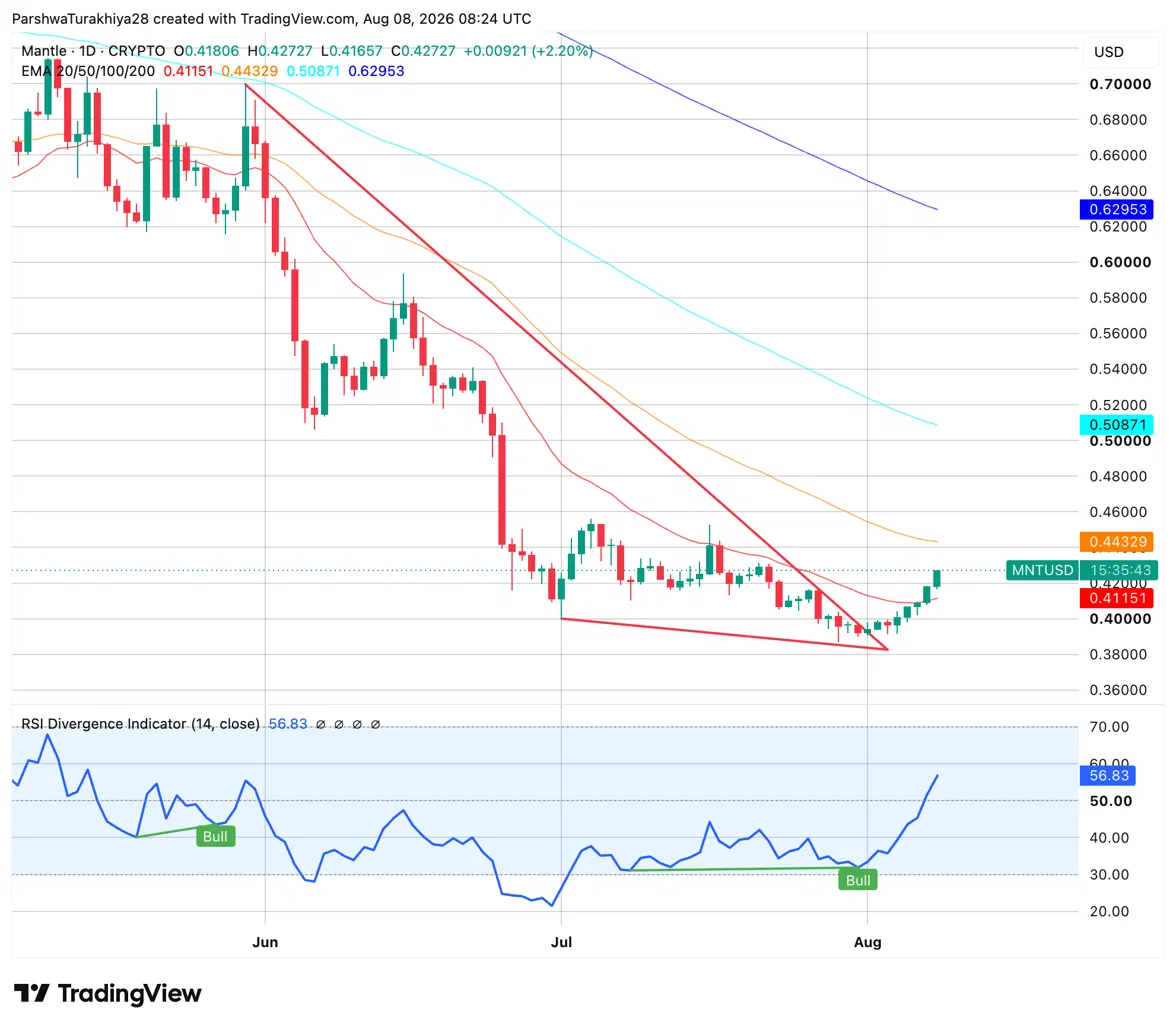
The daily chart shows MNT breaking above a long descending trendline that formed after the May peak. The trendline connected a series of lower highs from June through July, and today’s session cleared it with price opening at $0.418, pushing to $0.4273, and holding the gain. Two bullish RSI divergences are visible on the chart, one in May and a second in late July, both occurring where RSI made higher lows while price made lower lows. The second divergence has now triggered with today’s trendline break, adding momentum confirmation to the technical setup.
RSI at 56.83 sits above the neutral line for the first time since early June, confirming the trend shift is underway. All four EMAs remain above current price, however. The 20-day at $0.4115 has been reclaimed and now acts as the first support. The 50-day at $0.4433 is the immediate ceiling, followed by the 100-day at $0.5087 and the 200-day at $0.6295 as the broader recovery targets. A daily close above the 50-day at $0.4433 would be the next confirmation step.
MNT Support and Resistance Levels, August 2026
| Type | Price | Level |
| Resistance | $0.4433 | 50-day EMA, immediate ceiling |
| Resistance | $0.5087 | 100-day EMA |
| Resistance | $0.6295 | 200-day EMA, longer term target |
| Support | $0.4115 | 20-day EMA, first support |
| Support | $0.40 | Round number and prior trendline area |
| Support | $0.3800 | July low, last major floor |
August Seasonality: Strong Average but a Mixed Track Record
August is historically MNT’s second strongest month, averaging +9.27% across all available years. The 2025 reading of +58.1% is the standout, with 2024 delivering -16.3% and 2023 printing -13.6%. The median of -2.34% is the more cautious read, reflecting a wide range of outcomes. MNT has already printed +8.91% in August 2026, entering the month from a base following a 38.2% June collapse and a 4.68% July decline.
| Year | August Return |
| 2025 | +58.1% |
| 2026 (current) | +8.91% |
| 2024 | -16.3% |
| 2023 | -13.6% |
| Historical Average | +9.27% |
| Historical Median | -2.34% |
Mantle News: Super Portal Launches on Solana, Secured by Chainlink CCIP
Mantle launched its Super Portal on Solana on August 6, with the integration secured by Chainlink’s Cross-Chain Interoperability Protocol. The Super Portal is designed to give capital deployed on Mantle reach across multiple ecosystems rather than keeping it confined to a single chain. Chainlink Labs Chief Business Officer Johann Eid called the migration a recognition that secure-by-default infrastructure is critical for any cross-chain deployment to succeed at scale.
The Solana launch is the first external chain on the Super Portal with more to follow. For MNT, the practical implication is that Mantle’s capital markets infrastructure becomes accessible to Solana’s liquidity base, expanding the addressable market for assets issued or managed on Mantle without requiring users to leave their preferred ecosystem.
Separately, a July 31 Layer 2 roundup placed Mantle alongside Arbitrum, Linea, Starknet, and ZKsync as one of five leading Ethereum L2 networks. The analysis noted the completed 1:1 BitDAO to MNT token migration and highlighted TVL, dApp ecosystem size, and governance as the key differentiators in an increasingly competitive L2 landscape.
August 2026 Weekly Forecast
| Week | Price Range | Level to Watch | Scenario |
| Aug 1 to 8 | $0.40 to $0.45 | 50-day EMA at $0.4433 | Holding above the broken trendline and 20-day EMA confirms the breakout; a close above $0.4433 is the next step |
| Aug 11 to 15 | $0.41 to $0.52 | 100-day EMA at $0.5087 | Breakout follow-through targets $0.50; losing $0.4115 opens a retest of the trendline |
| Aug 18 to 22 | $0.43 to $0.56 | $0.50 to $0.51 zone | Mid-month consolidation above $0.50 sets up a run toward the 200-day EMA at $0.6295 |
| Aug 25 to 31 | $0.40 to $0.63 | Monthly close above $0.50 | A monthly close above the 100-day EMA would be the strongest signal for September continuation |
MNT Price Prediction August 2026: Upside and Downside Targets
Bullish Case, Target: $0.5087 (100-day EMA)
MNT holds above the broken trendline and the 20-day EMA at $0.4115 on any pullback, confirming the breakout is structural rather than a one-day move. The Super Portal’s Solana launch attracts fresh attention to Mantle’s cross-chain utility, and RSI sustaining above 50 confirms the momentum shift is intact. The 50-day EMA at $0.4433 clears on a daily close and price pushes toward the 100-day at $0.5087 by mid-month, consistent with August’s historical average return.
Bearish Case, Risk Level: $0.38 (July Low)
The trendline break proves to be a false move and MNT loses the 20-day EMA at $0.4115 on a daily close. Broader market weakness reverses the altcoin rotation that drove the August move, and the Super Portal launch fails to attract enough cross-chain volume to sustain momentum. Price retreats toward the $0.40 round number and, if that breaks, toward the July low near $0.38 where buyers would need to step in to prevent a deeper decline.
FAQs: Mantle ($MNT) Price Prediction
MNT trades at $0.4273 after breaking its descending trendline. The bullish target is $0.5087 (100-day EMA); the bearish risk level is $0.38 (July low) if the breakout fails to hold.
A second bullish RSI divergence triggered alongside the break, with RSI making higher lows while price made lower lows in May and again in late July. RSI at 56.83 has now moved above the neutral line for the first time since early June, confirming the shift.
The Super Portal lets capital deployed on Mantle move across other blockchain ecosystems instead of staying confined to Mantle alone. Its August 6 launch on Solana, secured by Chainlink CCIP, is the first external chain integration, opening Mantle’s capital markets infrastructure to Solana’s liquidity base.
Not entirely. The 9.27% historical average is skewed by 2025’s outlier +58.1% return, while 2024 and 2023 both posted double-digit losses. The median of -2.34% is a more realistic baseline, even though MNT has already gained 8.91% this August.
The 50-day EMA at $0.4433 is the immediate ceiling. Clearing it on a daily close opens the path toward the 100-day EMA at $0.5087 and, further out, the 200-day EMA at $0.6295.
MNT’s trendline break and RSI divergence are technically constructive, and the Super Portal launch adds a real fundamental catalyst, but August’s mixed seasonal track record and the still-overhead EMA stack mean the breakout isn’t confirmed yet. Weigh the bullish and bearish cases above against your own risk tolerance.
Conclusion
MNT’s trendline break carries more technical weight than most altcoin bounces, because it’s backed by a second confirmed RSI divergence and lands the same week as a real fundamental catalyst in the Super Portal’s Solana launch.
What keeps this from being a clean bullish call is the EMA stack still sitting entirely above price and August’s seasonal median running negative despite the flashy historical average. The 20-day EMA at $0.4115 is the line to watch hold it and the 50-day EMA at $0.4433 is the next test toward $0.50, while losing it turns this week’s breakout into a false move and sends MNT back toward the $0.38 July low.
Disclaimer: The information presented in this article is for informational and educational purposes only. The article does not constitute financial advice or advice of any kind. Coin Edition is not responsible for any losses incurred as a result of the utilization of content, products, or services mentioned. Readers are advised to exercise caution before taking any action related to the company.