


 Price Prediction 2025, 2026, 2027, 2028-2030")
After breaking below several key support zones in early 2025, Optimism (OP) has entered a critical inflection point on both the weekly and daily charts. With prices hovering around the $0.53 zone, the coming months will be crucial in determining whether OP can form a long-term bottom and reinitiate a structural uptrend.
Multiple technical signals now suggest a maturing downtrend and early signs of potential accumulation.
Optimism (OP) Price Prediction 2025
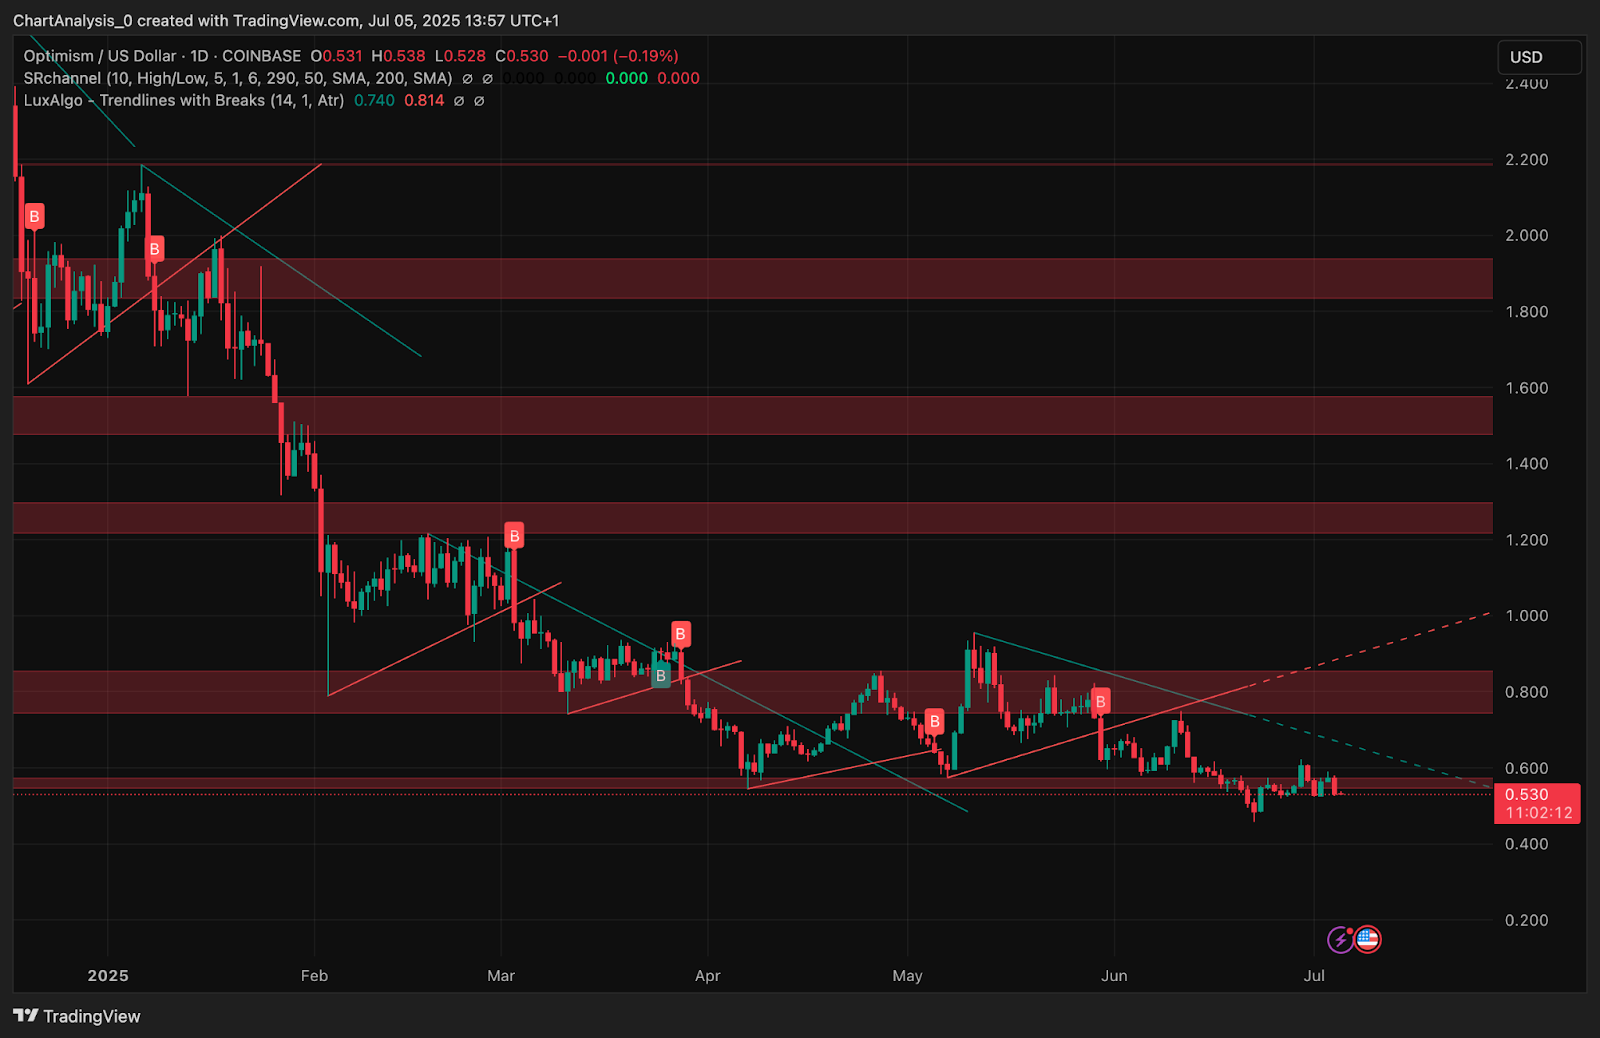
OP price has spent most of 2025 in a persistent downtrend, falling from above $2.50 in January to the current range near $0.53. This marks a full retracement toward historical support levels from late 2022 and early 2023. On the daily chart, the token is consolidating just above a weak liquidity floor and within a zone that previously triggered reversals.
Key resistance sits around $0.740–$0.814, while a breakdown below $0.50 could expose the $0.42–$0.45 demand block. Trendlines drawn from January highs continue to weigh on price, capping recovery attempts. Unless bulls reclaim the $0.65–$0.70 range soon, OP may stay trapped in a broad accumulation phase through the rest of 2025.
Optimism (OP) Price Indicators, Signals, Graphs and Charts (1y)
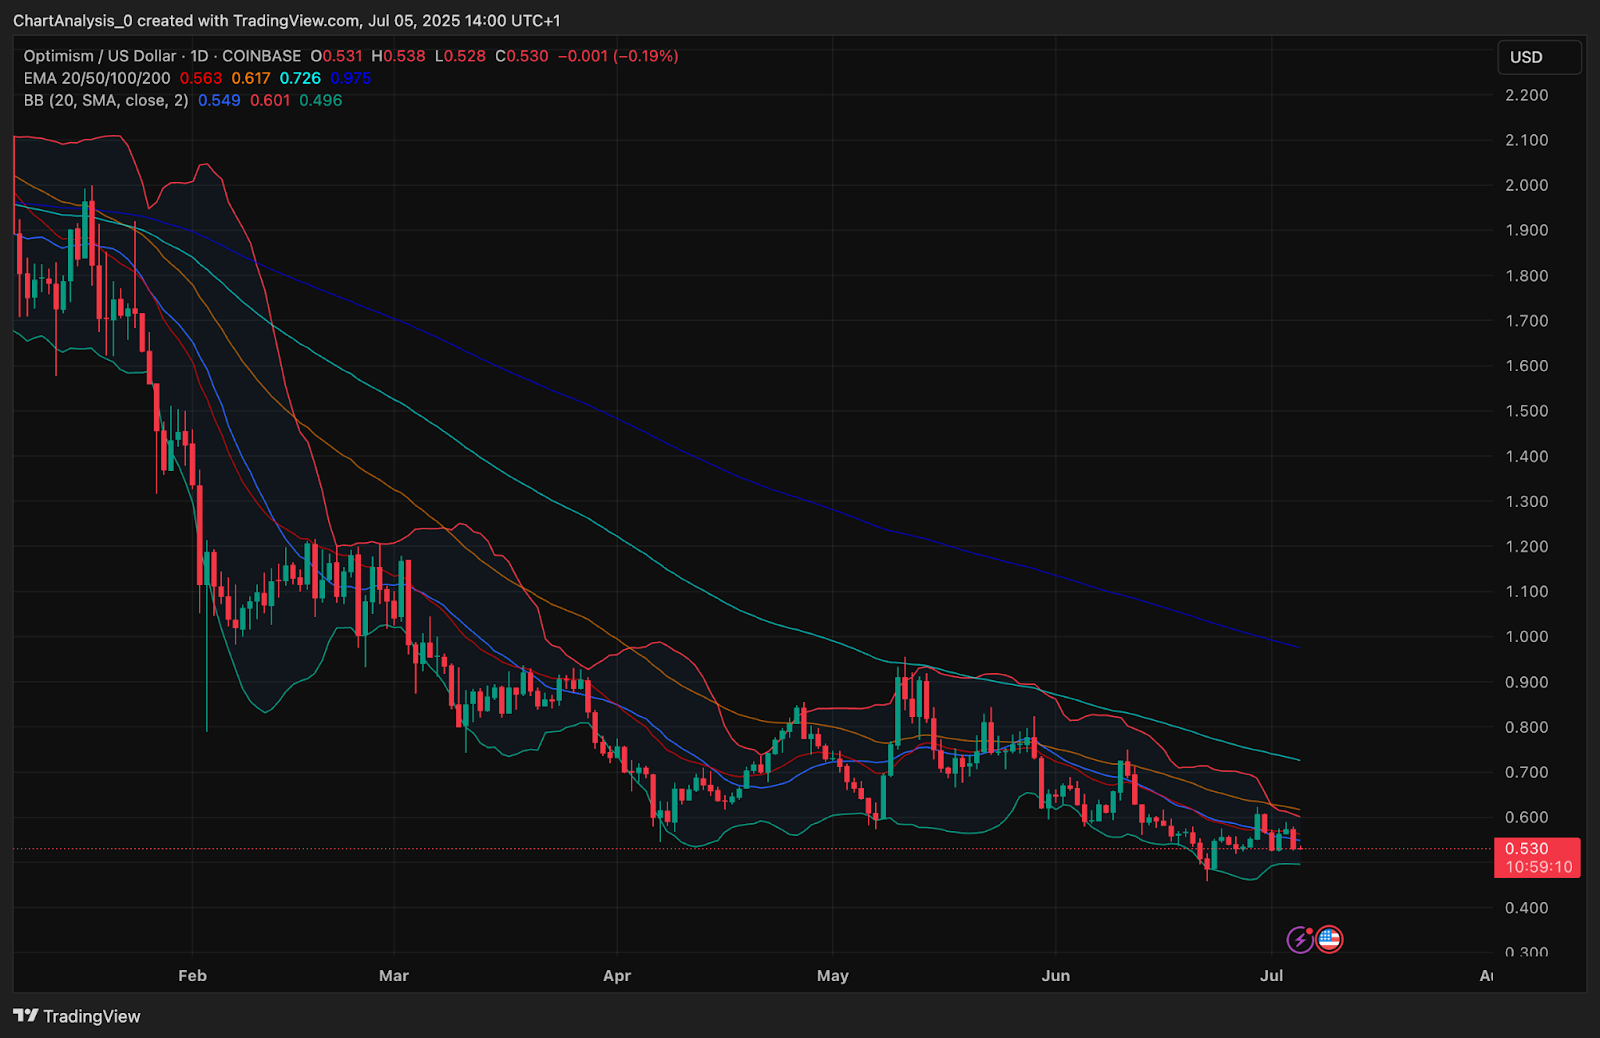
Over the past year, Optimism’s technical structure has remained under pressure, with the EMA ribbon presenting a strongly bearish alignment. The 20/50/100/200-day exponential moving averages are stacked downward, and the price continues to trade below all major moving averages. Notably, the 50 EMA near $0.617 and the 100 EMA around $0.726 have consistently acted as dynamic resistance zones, capping any meaningful bullish recovery attempts.
Bollinger Bands on the daily chart are currently in a contraction phase, signaling that volatility has compressed significantly. Historically, such squeezes are often followed by decisive breakout moves. At present, OP is hugging the lower band near $0.496, which could indicate that the token is nearing oversold territory and may be positioned for a volatility-driven move in either direction.
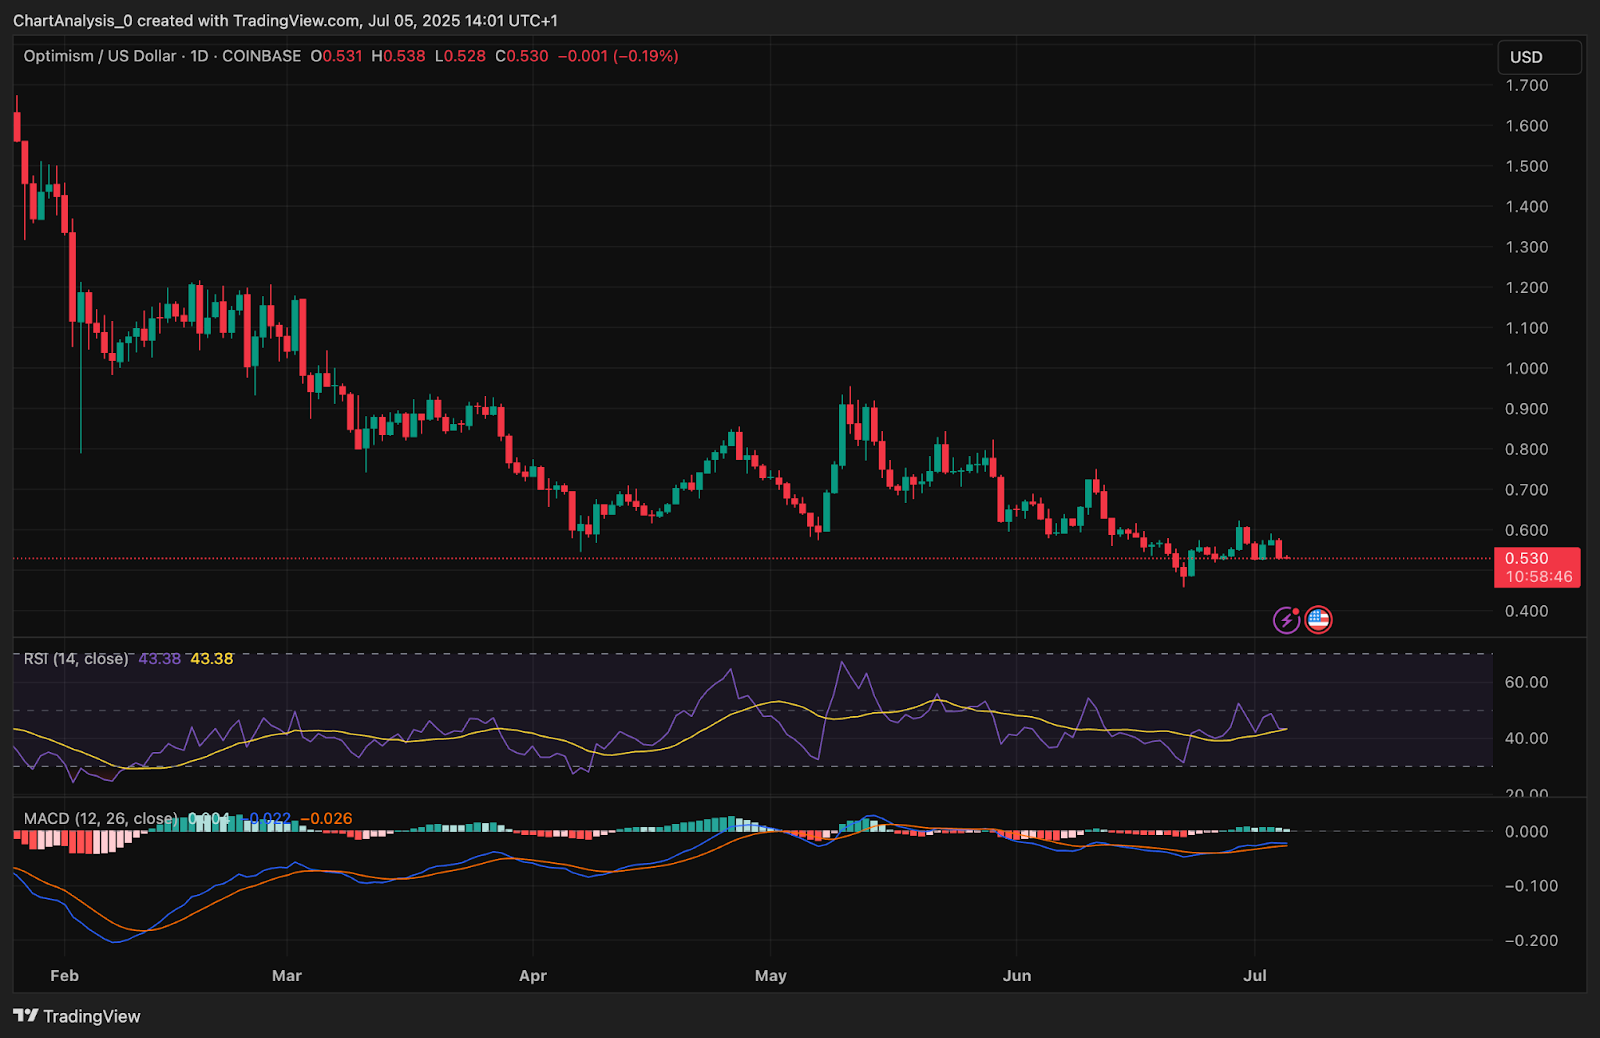
The Relative Strength Index (RSI) sits at 43.3, indicating that while the token is in a zone of weak momentum, it is not yet oversold. This level shows that bearish pressure persists but is beginning to stabilize. A decisive push above the neutral 50 mark on RSI would serve as an early signal of returning strength from the bulls.
On the MACD front, the lines are hovering close to the baseline, suggesting limited momentum. However, the histogram has begun to show faint signs of bullish divergence. This subtle shift implies that selling pressure may be losing steam and a short-term reversal could be in development if follow-through buying volume emerges.
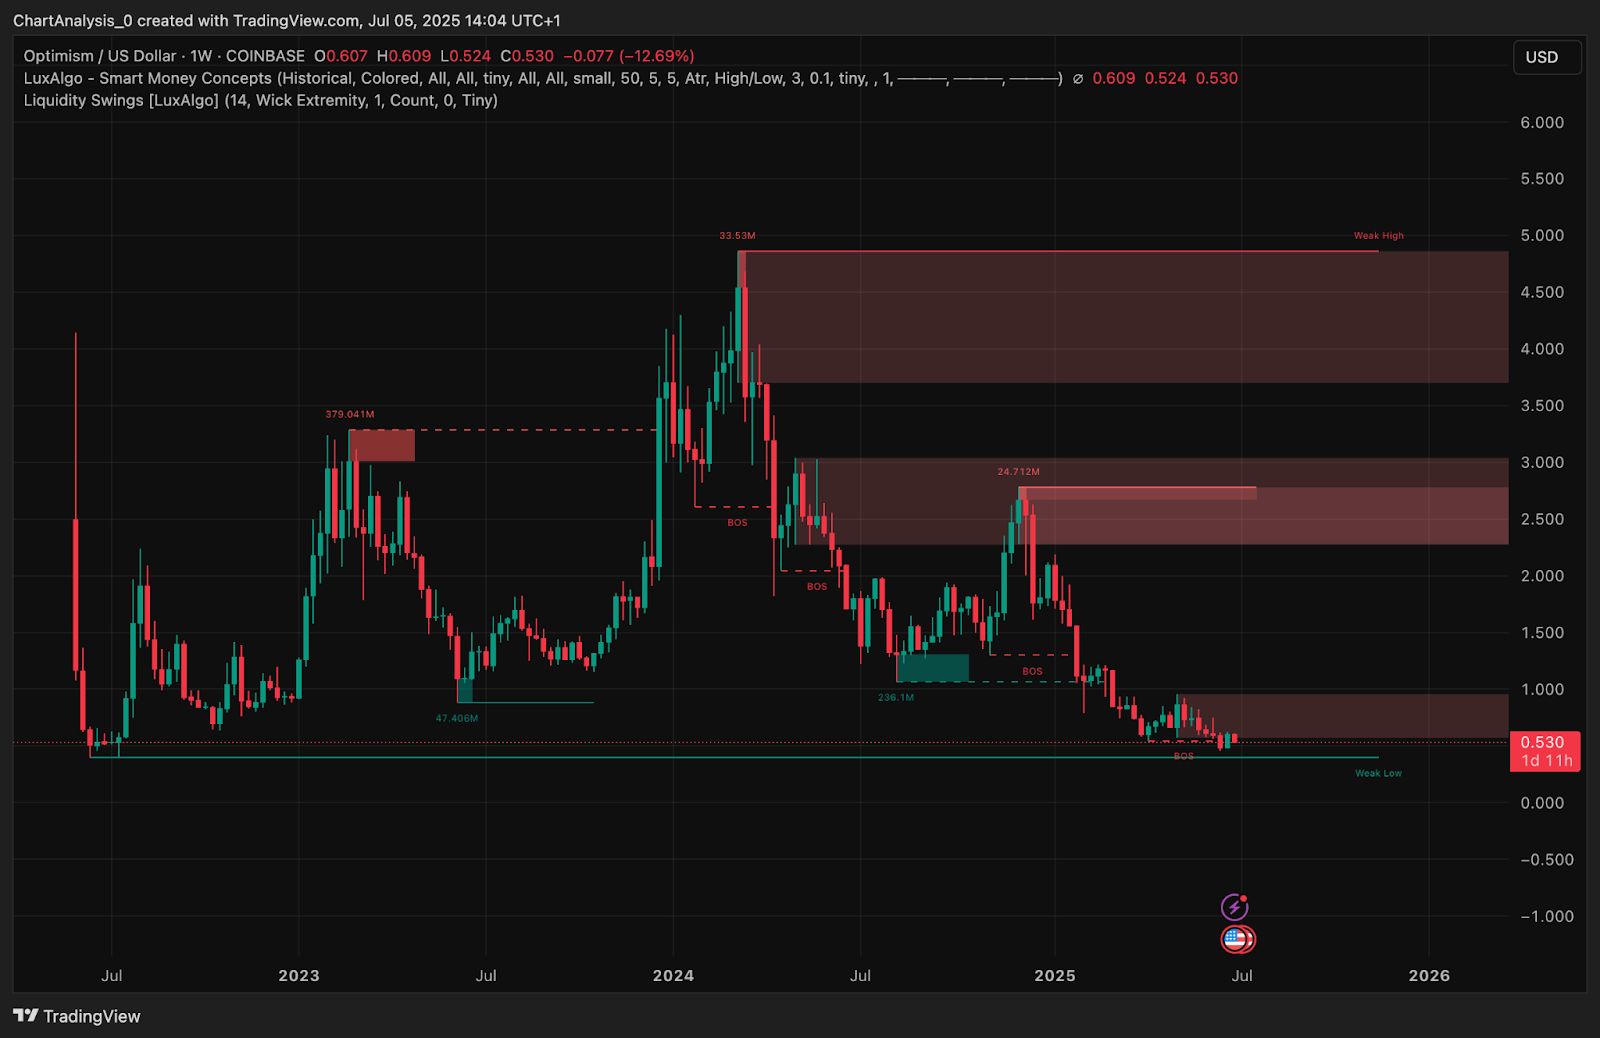
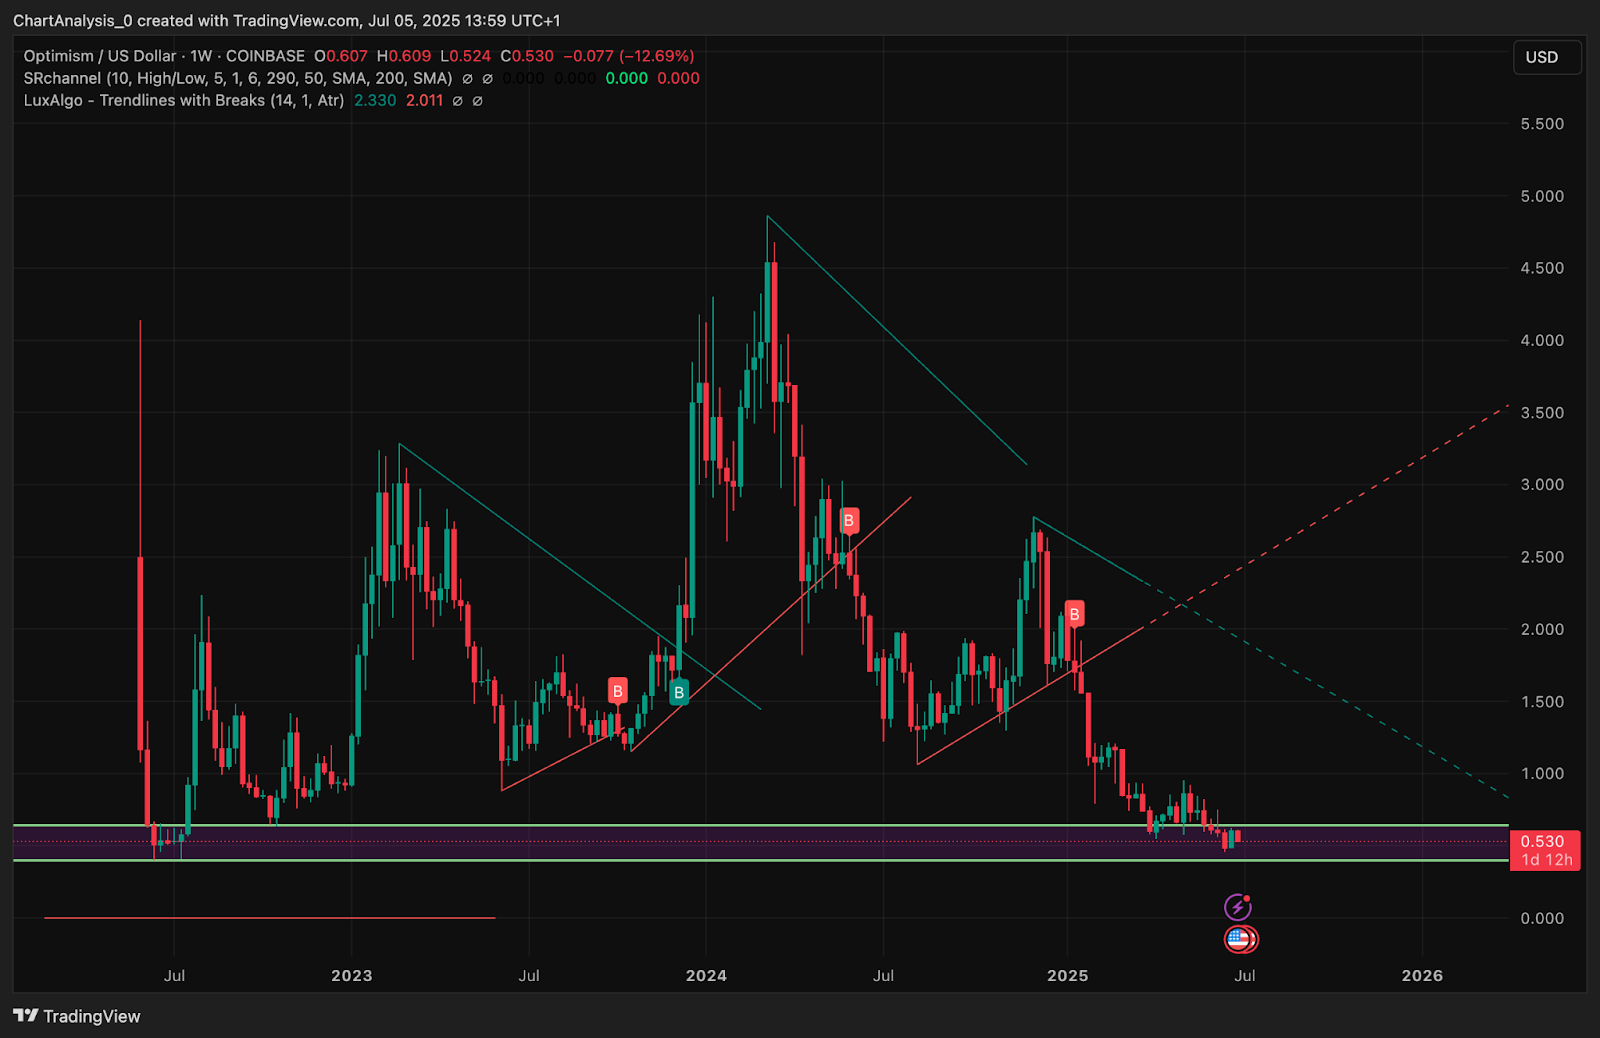
Lastly, from a Smart Money Concepts perspective, the weekly chart has shown a break of structure (BOS) below the $0.60 level. This was followed by liquidity sweeps near historical demand, reinforcing the significance of the $0.50 zone. This area now forms a weak low structure, and its defense will be critical. Should bulls hold this zone, it could serve as the base for a larger accumulation and eventual reversal.
Optimism (OP) Price Targets 2025 – 2030
| Year | Potential Low ($) | Potential Average ($) | Potential High ($) |
| 2025 | 0.420 | 0.650 | 0.900 |
| 2026 | 0.580 | 1.100 | 1.600 |
| 2027 | 0.850 | 1.700 | 2.400 |
| 2028 | 1.200 | 2.300 | 3.200 |
| 2029 | 1.500 | 2.800 | 4.100 |
| 2030 | 1.800 | 3.600 | 5.200 |
Optimism (OP) Price Prediction 2026
By 2026, if OP establishes a durable base above the $0.60–$0.70 zone and breaks the descending trendline, a structural reversal could take shape. Reclaiming the $1.00–$1.10 zone may attract long-term accumulation, with momentum likely accelerating toward $1.60 if volume confirms. However, rejection near the 100 EMA could cause retests of $0.58.
Optimism (OP) Price Prediction 2027
2027 could mark a return to pre-2024 levels, with the chart suggesting room for recovery toward $2.40 if OP maintains higher lows and breaks out from the long-term down channel. Bullish confirmation would strengthen if the asset consistently closes above $1.70. Accumulation from institutions or renewed L2 demand could serve as catalysts.
Optimism (OP) Price Prediction 2028
In 2028, broader crypto market expansion and L2 adoption growth could push OP above $3.00 for the first time since 2024. If the token builds a stable range above $2.00, continuation toward the $3.20 high is possible. Liquidity zones show limited resistance above $2.70, giving bulls a potential breakout runway.
Optimism (OP) Price Prediction 2029
The year 2029 may see OP challenge mid-cycle highs near $4.10, especially if it follows the historical rhythm of 3–4 year accumulation-to-expansion cycles. Key trend indicators would need to support momentum, while Fibonacci targets suggest $3.80–$4.00 as a logical extension. Corrections down to $1.50 may still occur if market volatility spikes.
Optimism (OP) Price Prediction 2030
Optimism’s long-term growth potential remains intact into 2030, especially if Ethereum scaling continues to depend on L2 rollups. A breakout beyond $5.00 is possible, with higher timeframe structures aligning for price discovery. Consolidation between $3.20 and $5.20 would reflect a mature, institutionally-driven range. Support is expected near $1.80.
Conclusion
Optimism’s multi-year price trajectory will largely depend on how well it defends the $0.50–$0.60 zone and whether it can regain trendline resistance above $0.80. With current indicators flashing early signs of accumulation and the macro cycle resetting, OP may offer a compelling long-term setup if buyers reclaim control. Caution remains necessary in the short term, but if critical levels are held, OP could chart a path back toward $4.00–$5.00 by 2030.
Disclaimer: The information presented in this article is for informational and educational purposes only. The article does not constitute financial advice or advice of any kind. Coin Edition is not responsible for any losses incurred as a result of the utilization of content, products, or services mentioned. Readers are advised to exercise caution before taking any action related to the company.
 Price Prediction: Can BTW Sustain Its Breakout Above $0.1032?")


