


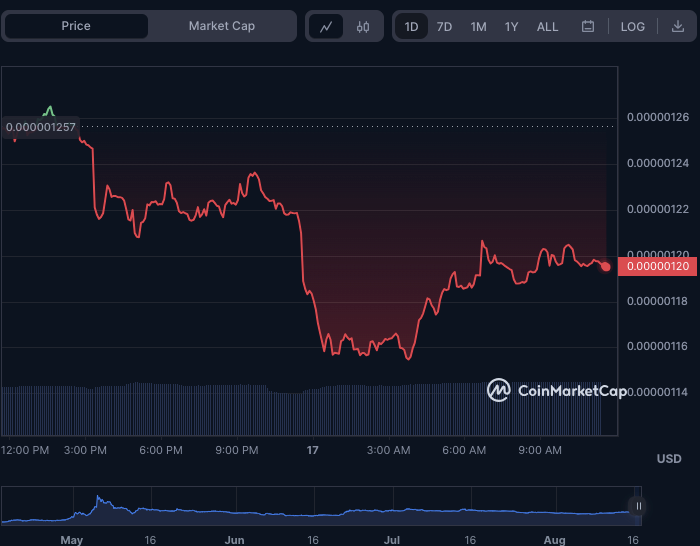
- PEPE’s price rebounds from a 7-day low, indicating rising buying interest.
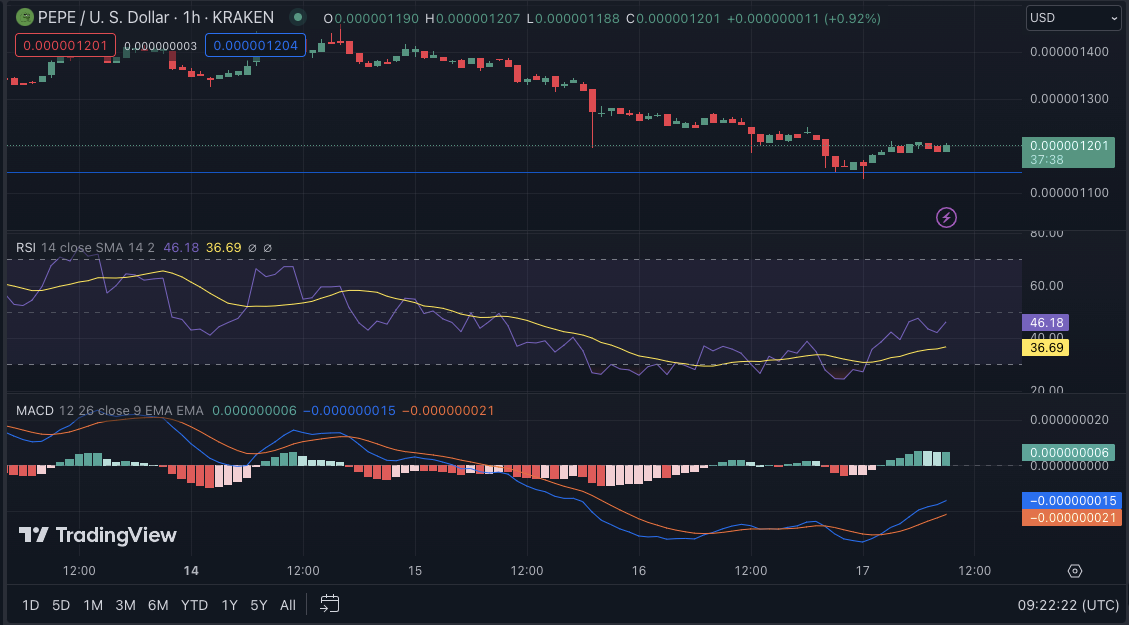
- The rising MACD suggests a potential shift to bullish momentum.
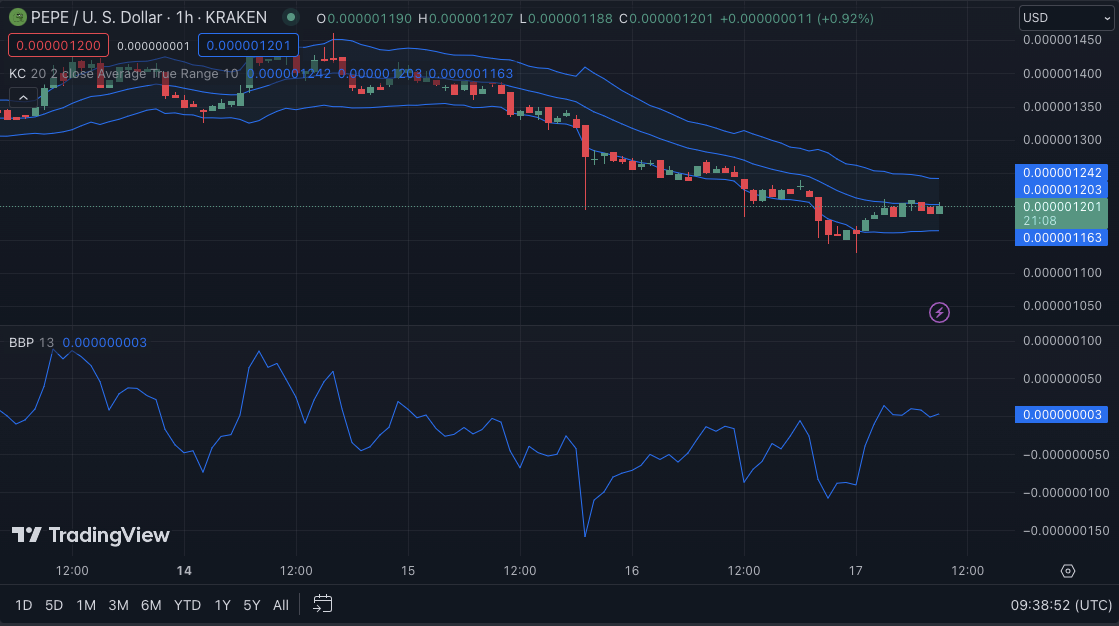
- Market consolidation points to a probable breakout for PEPE.
Pepe’s (PEPE) price fell to a 7-day low of $0.000001148 in the last 24 hours as bulls failed to break through the intra-day high of $0.000001265. Despite the initial drop, Pepe’s price recovered slightly and settled around $0.000001196, a 4.62% drop from the intraday high at press time.
This minor rebound suggests that there is still some purchasing pressure in the market, suggesting the possibility of additional price movement.
Despite the price drop, PEPE’s market capitalization fell by 5.11% to $468.54 million, while its 24-hour trading volume increased by 8.89% to $130.15 million. This surge in trading volume indicates that there is still tremendous interest and activity in the Pepe market, implying that additional fluctuations in prices are possible.
The Moving Average Convergence Divergence (MACD) on the PEPE/USD 1-hour price chart is heading upward despite being in the negative sector with a reading of -0.000000017. This pattern suggests that selling pressure may be easing and that there may be a turn toward bullish momentum.
With the histogram in the positive zone and the MACD line approaching zero, purchasing pressure is beginning to overwhelm selling pressure. This shift cautions traders to consider establishing long positions in anticipation of a possible rally in the price of the PEPE/USD.
The Relative Strength Index (RSI) of 42.11 and trending downward indicates that the market is now in a mildly negative mood. However, the price can rebound because the RSI is still above the oversold level of 30. If purchasing pressure continues to rise and the RSI rises, it might signal a shift in market sentiment toward a positive trend.
The linear trend of the Keltner Channel band, with the upper, middle, and lower bands touching 0.000001242, 0.000001203, and 0.000001163, indicates a market consolidation period.
With the price action continuing toward the middle band and producing a green candlestick pattern, buyers are taking control, and the market may be preparing for a potential breakout.
In addition to the potential bullish trend indication, the Bull Bear Power (BBP) heading upwards with a rating of 0.000000003 implies increased purchasing pressure. This BBP trend indicates a rising imbalance between buyers and sellers, with purchasers gaining market dominance. This move adds to the case for a probable breakout and enhances the market’s positive perspective.
In conclusion, Pepe’s price shows resilience amid fluctuations, hinting at possible bullish momentum ahead. Increased trading activity and positive indicators suggest a potential breakout.
Disclaimer: The views, opinions, and information shared in this price prediction are published in good faith. Readers must do their research and due diligence. Any action taken by the reader is strictly at their own risk. Coin Edition and its affiliates will not be liable for direct or indirect damage or loss.
Disclaimer: The information presented in this article is for informational and educational purposes only. The article does not constitute financial advice or advice of any kind. Coin Edition is not responsible for any losses incurred as a result of the utilization of content, products, or services mentioned. Readers are advised to exercise caution before taking any action related to the company.


