


- RSI and MACD indicators suggest a continued short-term bearish trend for PEPE/USD.
- Market cap and trading volume for PEPE drop during retracement, signaling reduced investor interest.
- PEPE (PEPE) faces bearish pressure as the price dips 2.68% in 24 hours, testing support at $0.000001054.
Pepe (PEPE) witnessed a retracement during the last 24 hours, with its price falling from an intraday high of $0.000001097 to a 24-hour low of $0.000001054, where it found support. PEPE was priced at $0.000001066 at press time, a 2.68% decline from its intra-day high.
During the bearish reign, PEPE’s market capitalization and 24-hour trading volume fell by 2.70% and 16.75%, respectively, to $445.2 million and $42.78 million. This drop in market capitalization and trading volume reflects a fall in investor interest and activity in PEPE during the retracement period.
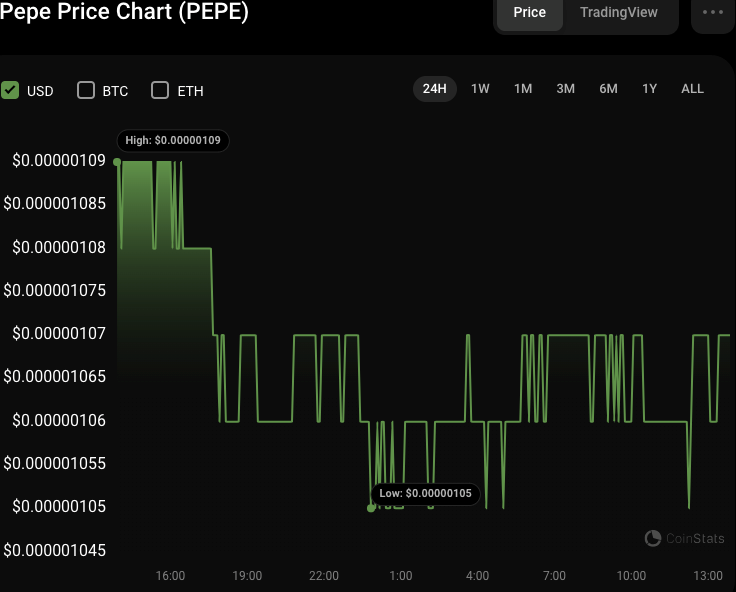
PEPE/USD 24-hour price chart (source: CoinStats)
If the bearish trend continues and the $0.000001054 support level is breached, the following support levels for PEPE might be $0.000001045 and $0.000001035. Previously, these levels have demonstrated some consistency during past retracements. However, if the bearish pressure continues to build, subsequent support levels around $0.000001025 and $0.000001015 may be tested.
However, if PEPE manages to break over the resistance level of $0.000001065, a bullish reversal could ensue. The following resistance levels to watch out for in this situation are $0.000001075 and $0.000001085.
PEPE/USD Technical Analysis
The Relative Strength Index (RSI) on the PEPE/USD 24-hour price chart moves below its signal line with a rating of 46.90, indicating that the present bearish trend may persist in the short term. This anticipation of a continued bear rally is because the RSI suggests that the selling pressure is stronger than the buying pressure since it has yet to reach oversold territory.
Furthermore, the Moving Average Convergence Divergence (MACD) is indicating a negative trend with a reading of -0.000000003. This shift into negative territory means that the price of PEPE/USD may continue to fall.
In addition, the MACD histogram shows a decline in positive momentum, supporting the bearish perspective. This combination of indications indicates that PEPE/USD’s price will likely remain under pressure in the short term.
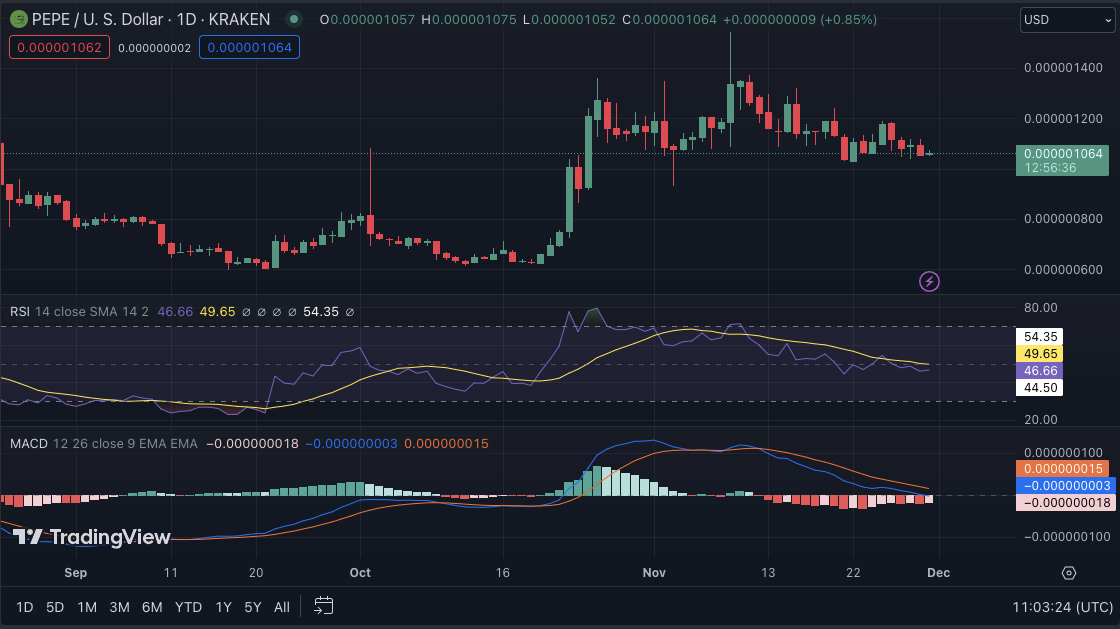
PEPE/USD 24-hour price chart (source: TradingView)
In conclusion, PEPE faces bearish pressure as it retraces, with support levels at $0.000001054 and $0.000001045. Breaking $0.000001065 could signal a bullish reversal, but current indicators suggest a continued short-term bearish trend.
Disclaimer: The information presented in this article is for informational and educational purposes only. The article does not constitute financial advice or advice of any kind. Coin Edition is not responsible for any losses incurred as a result of the utilization of content, products, or services mentioned. Readers are advised to exercise caution before taking any action related to the company.


