


- PEPE’s tight volatility could leave it trading below $0.0000071 while WIF might jump toward $3.96.
- FLOKI might rise to $0.00023 but XRP might fail to hit $0.62.
- The RSI and Fib levels supported DOGE’s increase to $0.21 but SHIB might be stuck at $0.000028.
The weekend brought relief to the crypto market after participants endured a week mostly full of downsides. Although the respite might not be very significant, it offered balance— something that was rarely seen recently.
As such, it was not surprising that a large part of the $86.72 million 24-hour liquidations were short positions.
Memecoins were not left out as prices in the market recovered. According to CoinMarketCap, the likes of Pepe (PEPE), dogwifhat (WIF), and Floki (FLOKI) saw their values increase. It was a similar situation with Dogecoin (DOGE) and Shiba Inu (SHIB). However, Ripple (XRP) registered a mild jump before it cooled off.
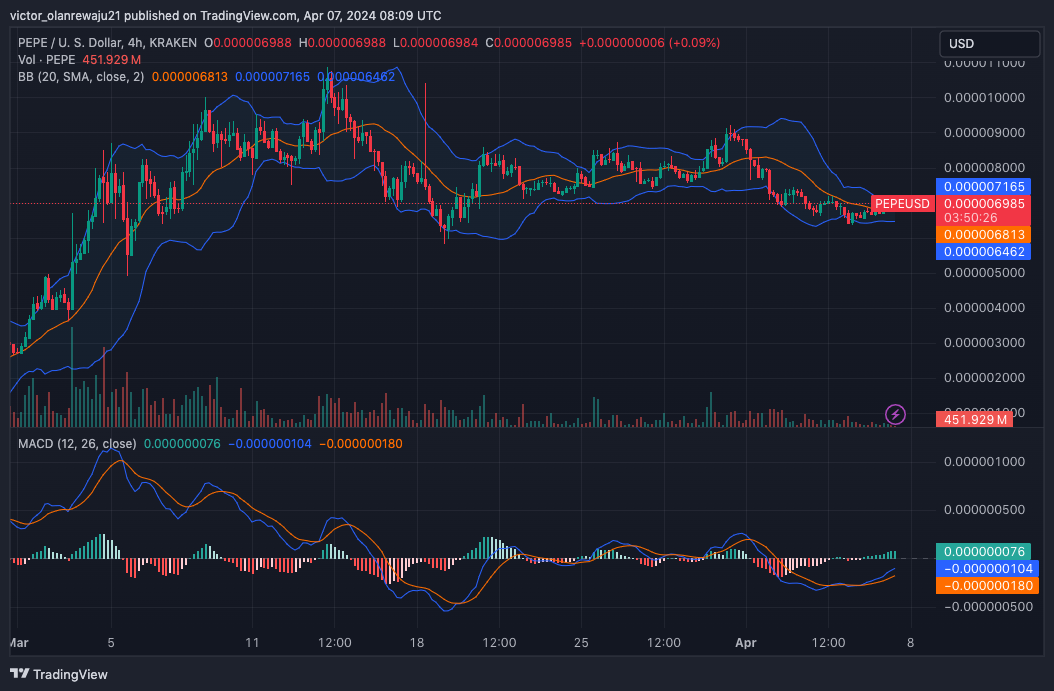
PEPE
Despite PEPE’s price increase, the 12 and 26 EMAs remained in the negative region. The state of the indicators, alongside the MACD implied that PEPE’s bullish outlook could be a false call, and the upward momentum might soon stall.
Furthermore, the Bollinger Bands (BB) displayed a tight volatility for the token as the bands contracted. With this position, PEPE might find it hard to swing higher than $0.0000071 in the short term.
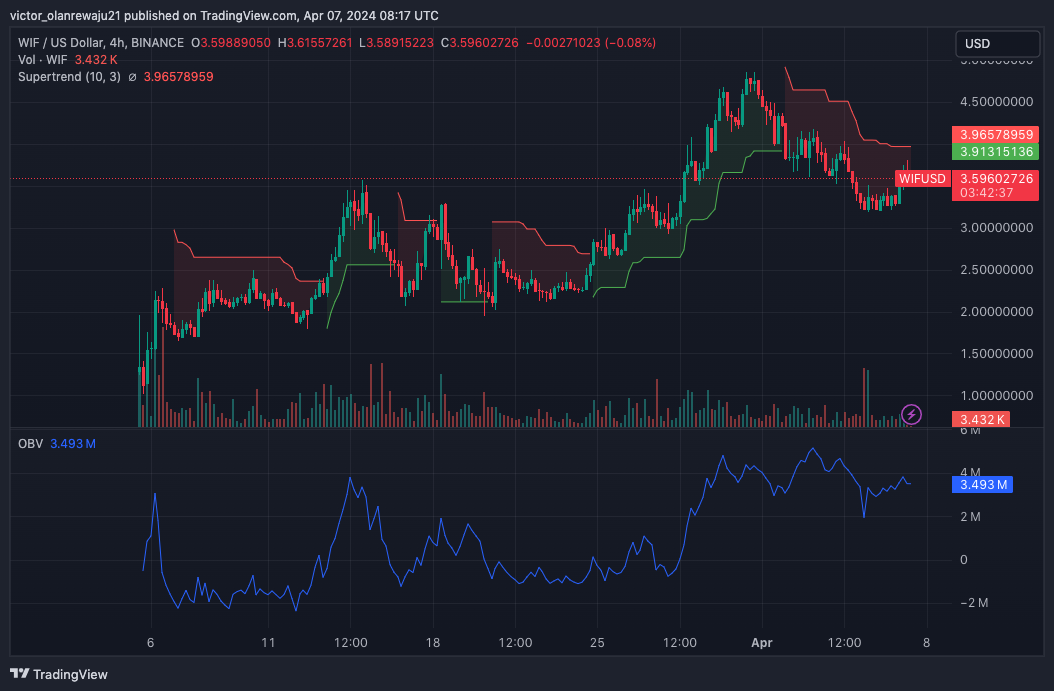
WIF
WIF gained 5.90% in the last 24 hours. But a red candlestick on the 4-hour chart seemed to have stopped that uptrend. Despite the slight decline, the price of the memecoin might get close to $4 in the short term, depending on the buying momentum.
However, the Supertrend showed a sell signal at $3.96. Should WIF approach this path, bears might force a rejection that could decrease the value to $3.21.
Meanwhile, the On Balance Volume (OBV) increased, suggesting the presence of buying pressure. If buying pressure increases, WIF might jump toward $4.25. But that prediction was not yet validated.
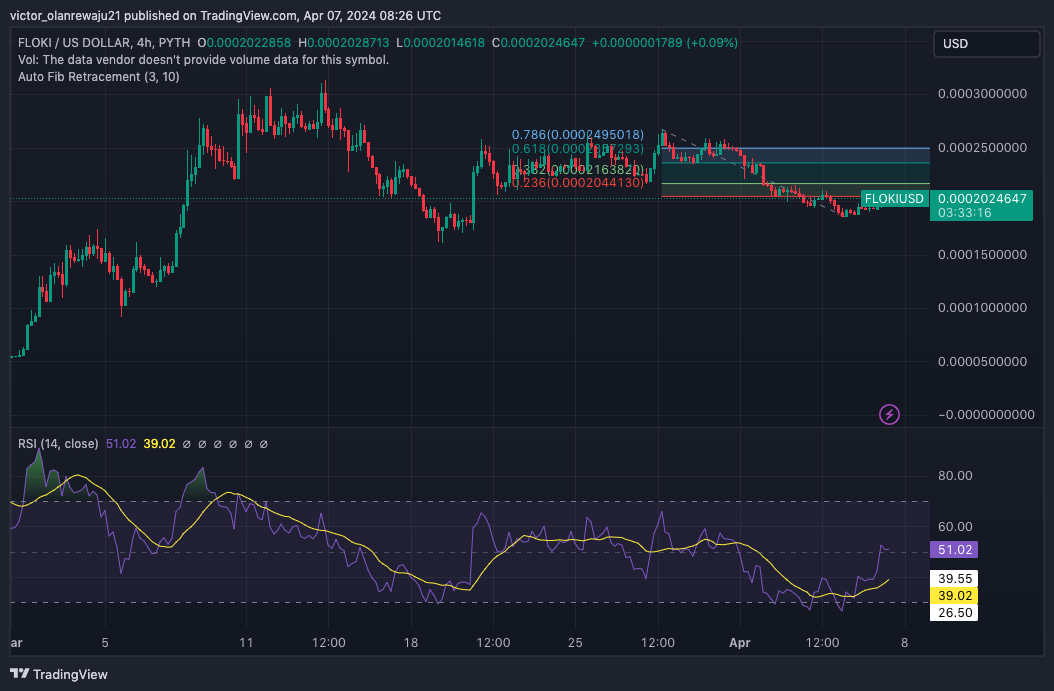
FLOKI
FLOKI’s price of this writing, was $0.00020, representing a 3.85% 24-hour increase. From the technical outlook, the RSI indicated that buying momentum had improved after the token was oversold on April 5.
With this momentum, the price of FLOKI could head toward $0.00023. However, the Fibonacci retracement indicator revealed that the prediction was conservative. Instead, signals from the indicator showed that FLOKI could rise to $0.00025 where the 0.786 Fib level stood.
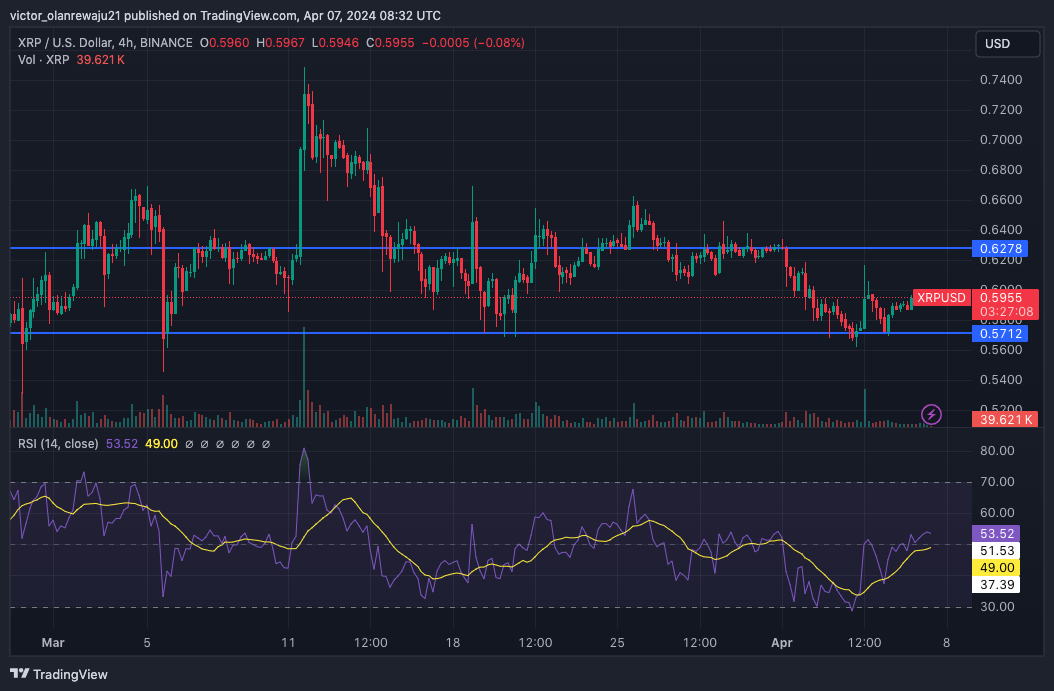
XRP
At press time, the 4-hour XRP/USD chart showed that the token was getting close to $0.60. The reason for the move could be linked to the support at $0.57 which bulls took advantage of. However, as XRP rose, a resistance appeared at $0.62 which could be crucial to the price action.
As it stands, the RSI supported a move toward the aforementioned region. But if the token retests $0.62, it could reverse and the next thing could be to consolidate in the short term.
DOGE
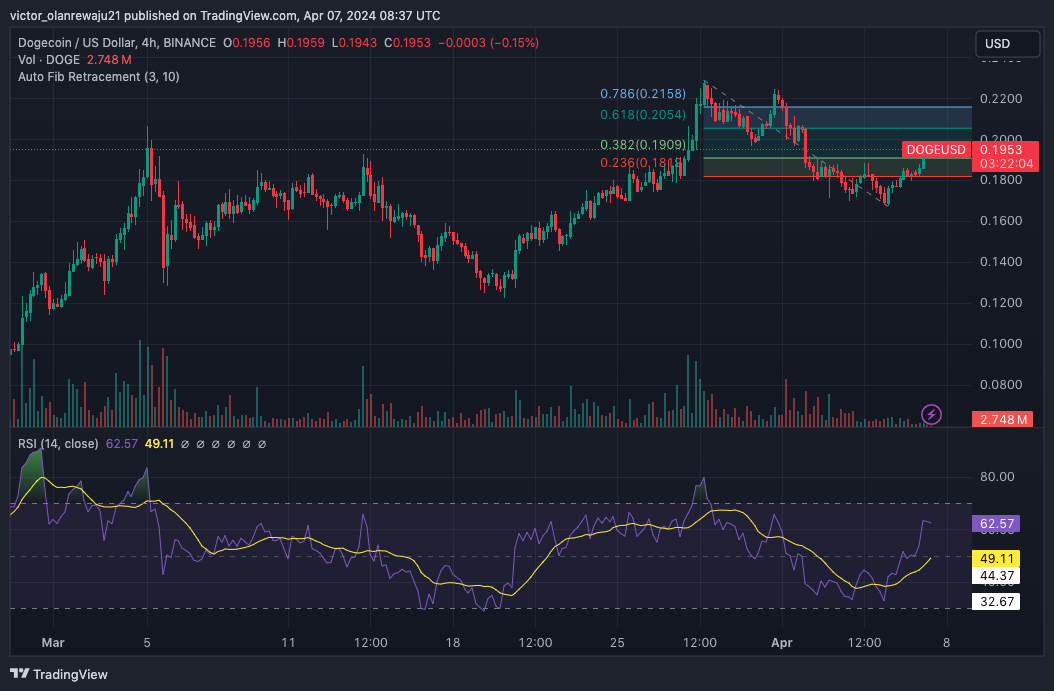
Out of the top 10 assets, Dogecoin registered the highest gain. Interestingly, the meme coin showed a similar signal to FLOKI when Coin Edition looked at the Fibonacci indicator. As of this writing, the 0.786 Fib level revealed that DOGE could appreciate to $0.21 within a short period.
The Relative Strength Index (RSI) also backed this forecast as its reading increased. However, traders might need to watch the coin’s trend. If the RS hits 70.00 or crosses, Dogecoin might get overbought, and the price might retrace.
SHIB
On the 4-hour timeframe, SHIB displayed a readiness to revisit $0.000032. But at press time, the price was below $0.000030, indicating that it might have to surpass the overhead resistance if it aimed to hit the aforementioned value.
In the meantime, the Awesome Oscillator (AO) was positive, indicating increasing upward momentum. If the reading of this indicator increases, then SHIB’s bullish thesis could be validated.
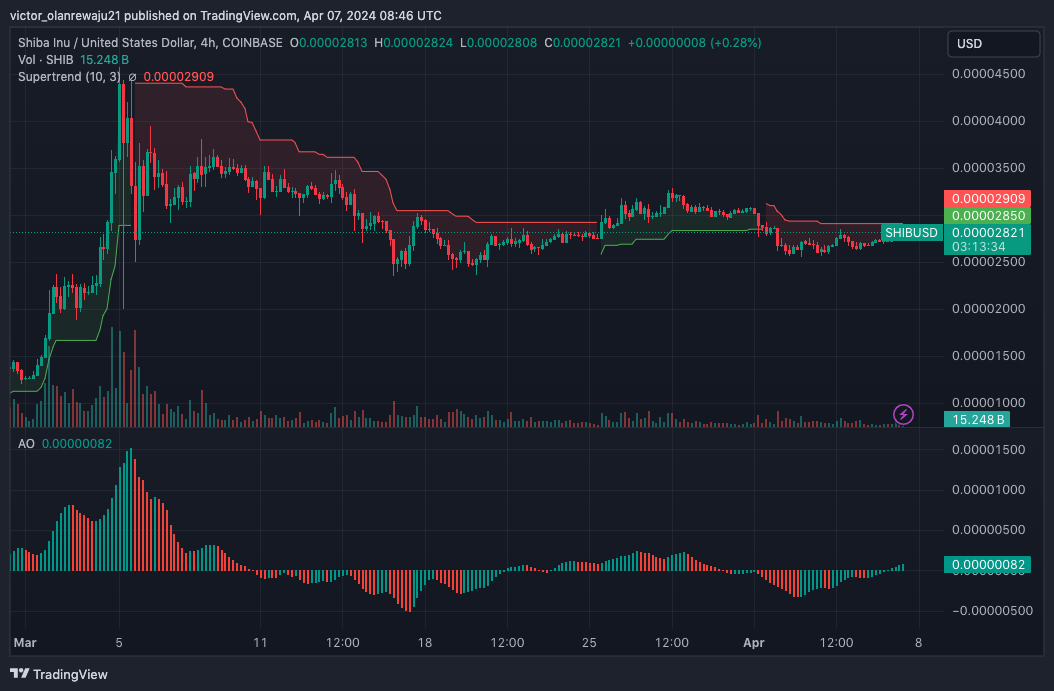
On the other hand, the Supertrend showed that the attempt could be null and void as a sell signal appeared just above $0.00028. Therefore, the price action depends on bulls and bears. If bears take bulls out of the way, the Supertrend forecast might come to pass. If not, SHIB might cross $0.000030.
Disclaimer: The information presented in this article is for informational and educational purposes only. The article does not constitute financial advice or advice of any kind. Coin Edition is not responsible for any losses incurred as a result of the utilization of content, products, or services mentioned. Readers are advised to exercise caution before taking any action related to the company.


