


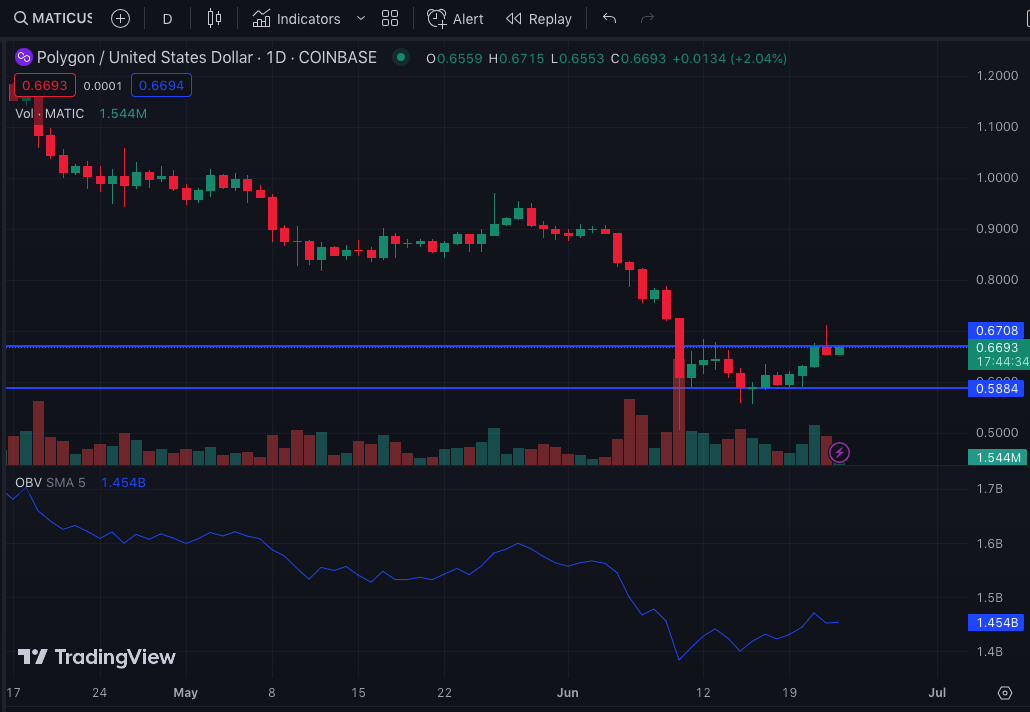
- MATIC’s OBV flattened from recent highs, signaling distribution over increased accumulation.
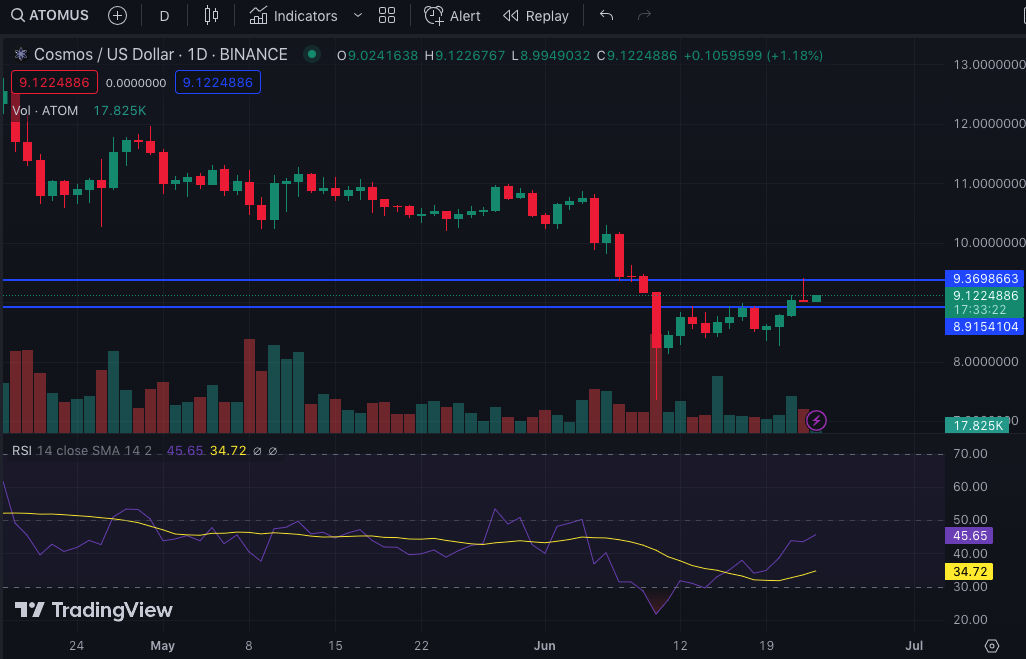
- ATOM’s momentum could back the bullish price strength provided market sentiment does not turn gloomy.
- The 20 EMA on the FTM daily chart slides below the 50 EMA, implying an emerging resistance at $0.29.
The daily active addresses of Polygon (MATIC), Cosmos (ATOM), and Fantom (FTM) topped other blockchains on a Month-on-Month (MoM) basis. According to data from crypto metric provider Artemis, Fantom addresses soared by 70.1%. Polygon picked up steam with a 225.9% hike while Cosmos grew by 85.2%.
The increase in the metric implies that an impressive number of users participated in sending or receiving tokens via each of these networks.
For Polygon, the spike could be linked to the developmental strides with NFTs and the Polygon 2.0 introduction.
On the other hand, Cosmos, which prides itself as the “Internet of Blockchains” also encouraged NFT transactions on its network over the last 30 days. Layer one (L1) project Fantom, in its own way, continued to contribute to the DeFi speed and scalability.
With respect to token value, MATIC and FTM grew by double-digits in the last seven days. However, ATOM was able to manage a 3.96% increase within the same time frame.
MATIC
MATIC’s upward trajectory might come to a halt despite the visible attempt by bulls to quench sell pressure at $0.67. One reason for this projection is the On-Balance-Volume (OBV).
As of this writing, the OBV seemed to have flattened after its rise since MATIC established demand at $0.58. This implies that accumulation was waning. If the OBV sustains the current state, then bears could end up neutralizing an upward breakout while distribution takes over.
ATOM
ATOM’s 30-day performance was in contrast to its 7-day hike. But unlike MATIC, it has the tendency to continue in the upward direction. This premise was based on its Relative Strength Index (RSI) which was 45.46.
The RSI value mentioned above suggests a relatively improving price strength. However, this could be subject to the ATOM’s ability to fend off profit-taking.
In between its rise, the bullish momentum had been stopped by sell candles (red) at $8.91 and $9.36. Therefore, traders might need to watch out for the broader market sentiment before taking a position.
FTM
Since May, FTM’s price action has been dealing with a series of reappearing resistance. On May 4, a sharp decline at $0.44 made room for bearish dominance till June 5 when another bullish candle met another resistance at $0.32.
Though there was respite in the last seven days, FTM might revert to consolidation. This was because of the countertrend movement of the Exponential Moving Average (EMA).
At press time, the 50 EMA (yellow) was below the 20 EMA (blue). Thus, suggesting that FTM’s momentum could be bearish in the near term.

In conclusion, FTM and MATIC prices might soon fade substantially. However, ATOM, despite having the lowest hike out of the tree, could increase further.
Disclaimer: The views, opinions, and information shared in this price prediction are published in good faith. Readers must do their research and due diligence. Any action taken by the reader is strictly at their own risk. Coin Edition and its affiliates will not be liable for direct or indirect damage or loss.
Disclaimer: The information presented in this article is for informational and educational purposes only. The article does not constitute financial advice or advice of any kind. Coin Edition is not responsible for any losses incurred as a result of the utilization of content, products, or services mentioned. Readers are advised to exercise caution before taking any action related to the company.
 Price Prediction: Can BTW Sustain Its Breakout Above $0.1032?")


