


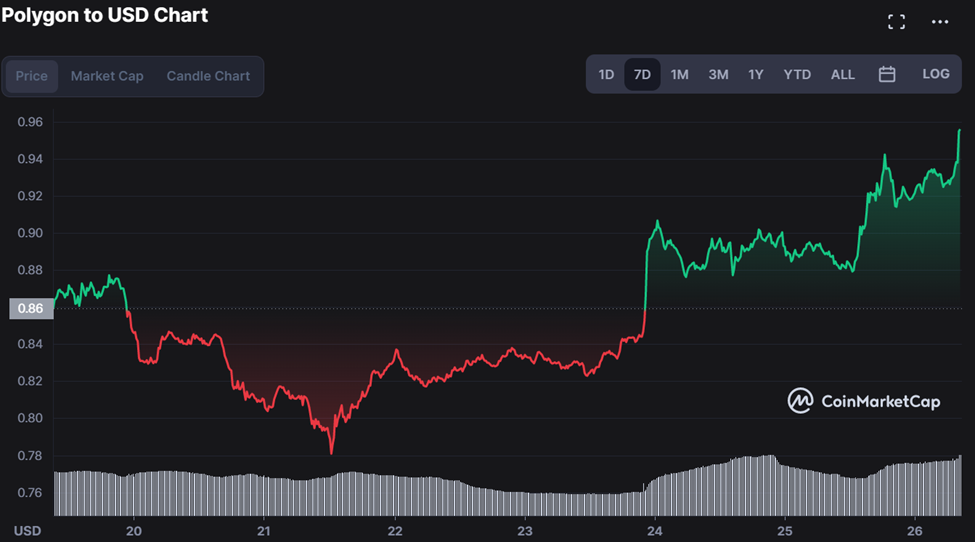
- MATIC surged by over 7% in the last 24 hours
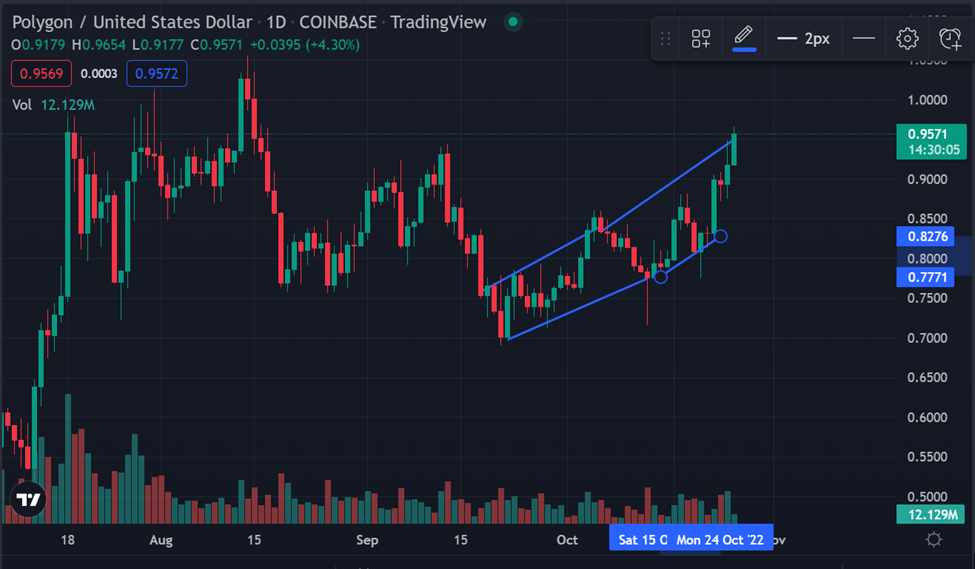
- Polygon’s current resistance level is $1.0
- Polygon surged to $1.0 but has stalled around this level, possibly due to profit taking
Recent developments in Polygon’s layer 2 scaling tool and partnerships with major companies have caused buying pressure. The recent price surge saw MATIC surge to $0.96, representing a 6.45% increase over the last 4 days and a point not seen in 2 months.
This comes after Polygon announced that it would be integrating with Nubank, a Brazilian fintech company backed by Warren Buffett’s Berkshire Hathaway and Softbank. Nubank has confirmed that it has selected Polygon’s “Supernets technology” for its blockchain and digital token, dubbed Nucoin.
Polygon is currently trading at $0.958 with a trading volume of $613,298,996.12 and ranked a position of 11. Polygon successively broke above the 200 Simple Moving Average and the 0.5 Fibonacci retracement level, which acted as resistance for the past few weeks. However, it has stalled at the $1 resistance level and may be facing profit-taking pressure.
Polygon is currently eying a bull flag formation on the daily chart, which may result in a price surge if it breaks above the resistance level at $1. A bull flag forms when there is a sharp price increase followed by a period of consolidation and is generally seen as a continuation pattern.
In addition, Polygon has surged past a potential ascending parallel channel and a descending resistance line, which could indicate further upside momentum.
MATIC seems to be following the broad-based market rally in the altcoin market, with a strong uptrend forming on its 4-hour chart. The technical indicators also show increasing buying pressure, with the Moving Average Convergence Divergence or MACD line crossing above the signal line. Moreover, the Relative Strength Index is currently at 70, indicating that the coin may be overbought and facing profit-taking pressure.
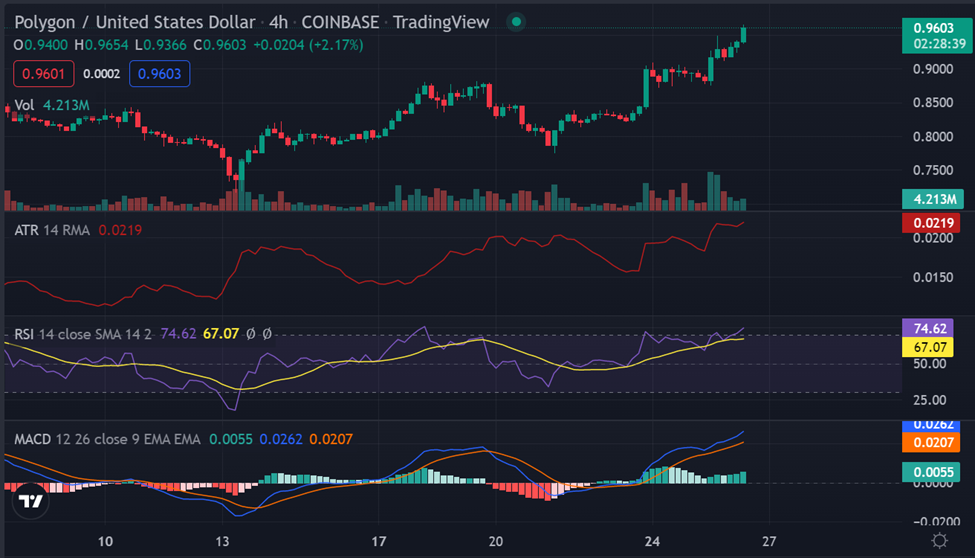
The ATR or average true range, which measures volatility, is also on the rise and indicates increasing market activity. Polygon has witnessed vigorous price change in the last 30 days, ranging from a low of $0.6981 on September 22 to a current high of around $0.9600, potentially signaling that it may be subject to higher volatility in the future.
The next key resistance levels to watch for MATIC are $1.20 and $1.50, with support levels at $0.8 and $0.6, respectively, while the support level at $1.0 may provide some cushion for any potential pullbacks in price. Overall, Polygon is in a firm uptrend, and recent developments and partnerships suggest that the uptrend may continue in the near term.
Disclaimer: The information presented in this article is for informational and educational purposes only. The article does not constitute financial advice or advice of any kind. Coin Edition is not responsible for any losses incurred as a result of the utilization of content, products, or services mentioned. Readers are advised to exercise caution before taking any action related to the company.


