


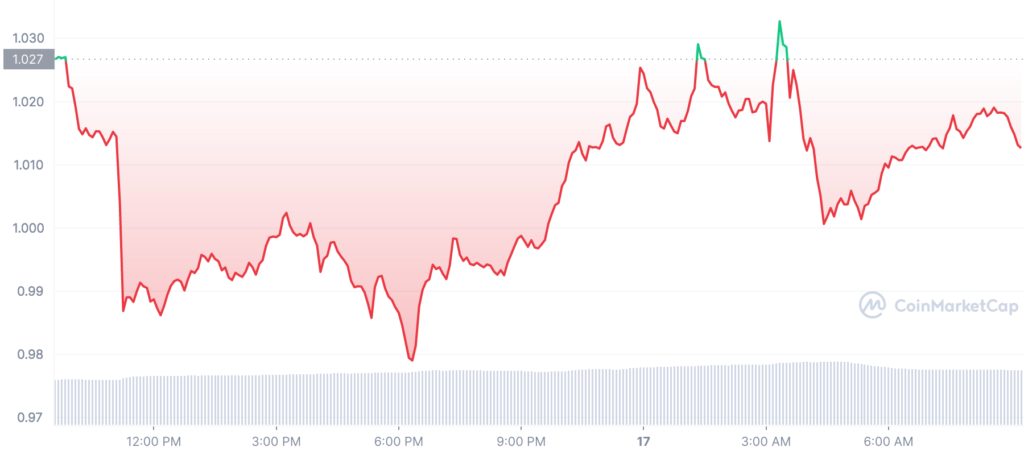
- MATIC has been on a bearish trend in the past day dragging the price to $1.01.
- Indicators show that the downtrend won’t last for long before a bullish reversal.
- Bulls are now in control in the four-hour chart.
Given that the price has been moving down over the last 24 hours, Polygon’s (MATIC) price analysis is indicating a drop. Although the cryptocurrency swayed positively earlier this week, bears have grabbed control and driven MATIC/USD prices down to $1.01 as of this writing.
In comparison to Bitcoin (BTC) and Ethereum (ETH), MATIC declined by roughly 1.03% and 0.68%, respectively. The 24 hour trading volume for MATIC is currently in the green zone at $561,268,461, an increase of more than 9.09% for the past day.
Despite the bearish sentiment, Polygon (MATIC) is ranks 10 in the largest cryptocurrency in the market with a market cap of $8,816,078,628 following a 1.06% decline.The MATIC analysis is confirming a fall in coin value, according to the daily chart price, which shows that the price has been moving in a bearish direction all day. The current bear reign is making the situation more advantageous for the sellers.
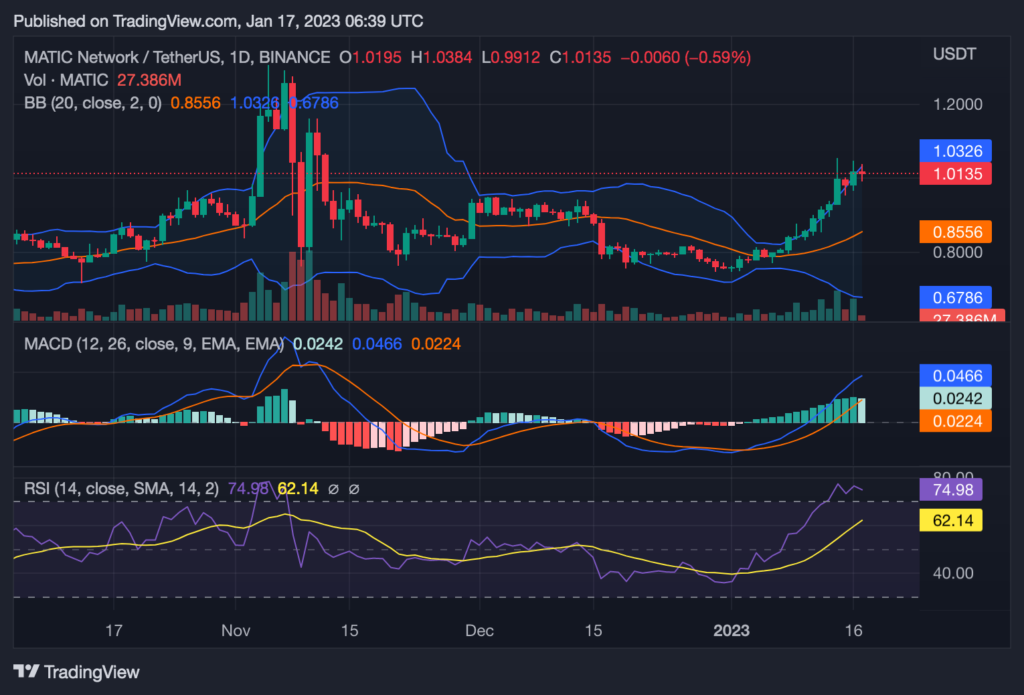
Technical indicators show mild signs of bearishnes which anticipates that the bulls may take control of the market soon. The fact that both the 50 SMA and the 100 SMA are lower than the price at which MATIC/USD is currently trading, shows that bears are in charge of the market and that the prices may drop. But if the bulls pump they could reverse the bearish trend.
More importantly, despite the little bear bite on the market, the Relative Strength Index (RSI) score has entered the overbought zone of 72.98, indicating that buyers are still confident about MATIC due to the buy pressure. The signal line is currently below the MACD line, and the moving average convergence and divergence (MACD) level is going into the positive territory which is another sign that MATIC will not stay in the bearish trend for long.
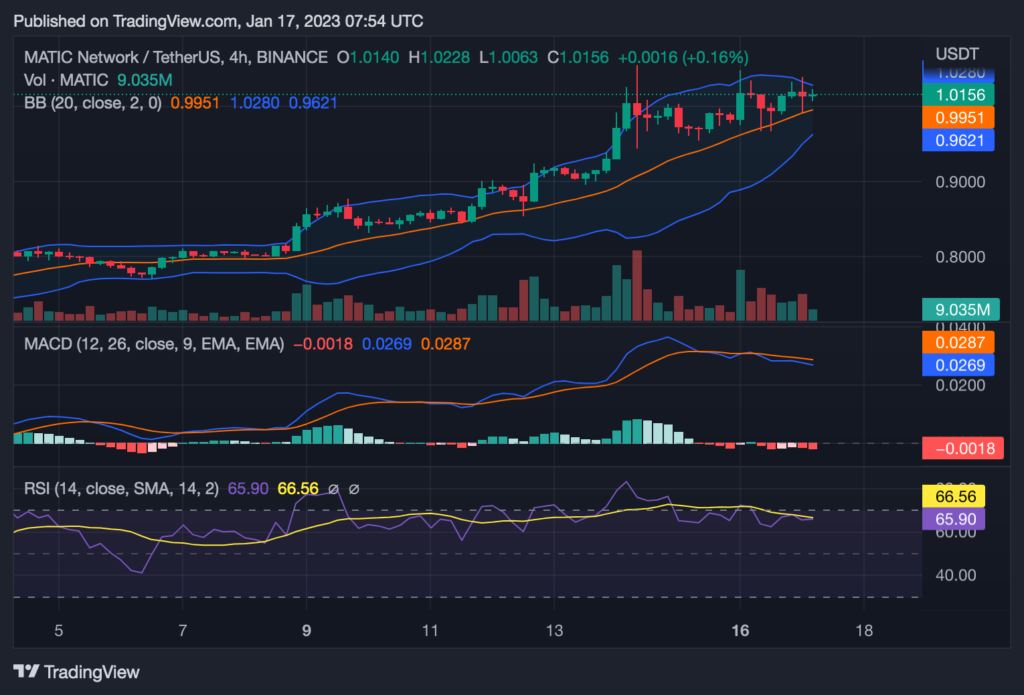
Analysis of the MATIC price on a 4-hour chart reveals that the prices are currently in the green zone as they have risen and are currently at $1.015 as of the time of publication. The market has been under the power of the bulls for the past few hours as they have battled the bears, and the short-term trend line has been rising. As a result, the market is becoming more volatile, which suggests that the price of MATIC is more likely to soon experience a variable change northward.
Disclaimer: The views and opinions, as well as all the information shared in this price analysis, are published in good faith. Readers must do their own research and due diligence. Any action taken by the reader is strictly at their own risk, Coin Edition and its affiliates will not be held liable for any direct or indirect damage or loss.
Disclaimer: The information presented in this article is for informational and educational purposes only. The article does not constitute financial advice or advice of any kind. Coin Edition is not responsible for any losses incurred as a result of the utilization of content, products, or services mentioned. Readers are advised to exercise caution before taking any action related to the company.


