


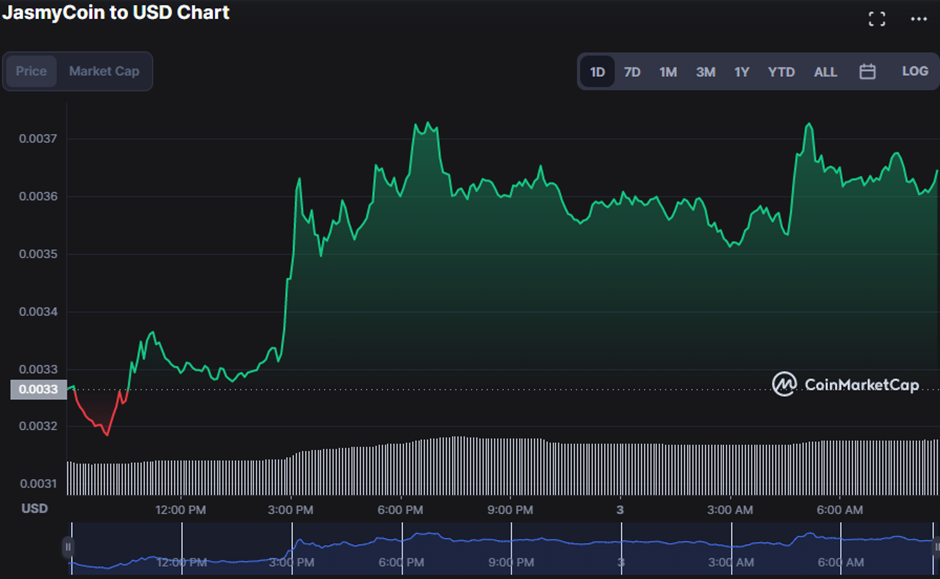
- The JASMY price dropped to an intraday low of $0.003181 due to the bearish trend.
- According to the JASMY market analysis, the recent upswing has a good chance of continuing.
- As a result of the current bullish trend, the price of JasmyCoin has risen by more than 20.68%.
JasmyCoin (JASMY) started the day trading at $0.0033 under bullish control, but later bears took control of the market, sending the price down to a low of $0.003181. However, bulls flocked into the market driving the prices to an interim high of $0.003759, and thereby burying this bearish trend. This bullish influence has persisted on the market, and prices have risen by 20.68%, to $0.003859 in the last few hours.
Following this bullish outburst, both market capitalization and 24-hour trading volume increased. This is shown by an 11.93% increase in the former to $169,206,405 and a 71.46% climb in the latter to $169,206,405 in the previous 24 hours.
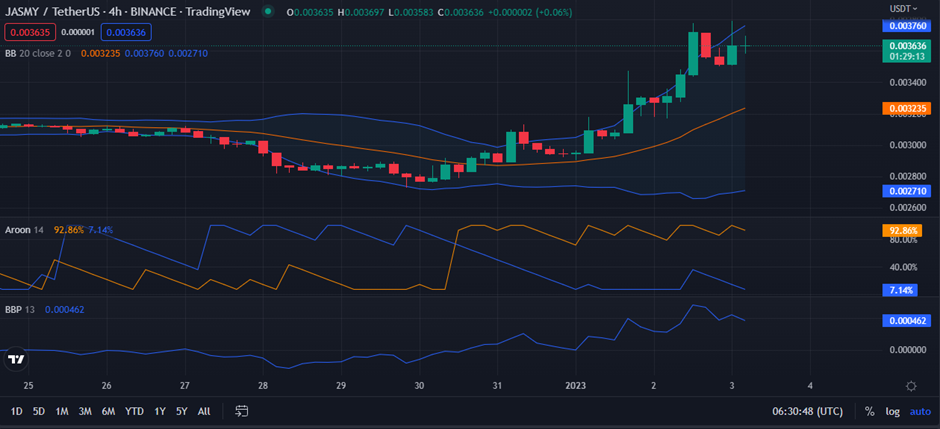
The Bollinger Bands are broadening as the upper band reaches $0.003765 and the lower band touches $0.002707, indicating more market volatility. This rising volatility improves the likelihood of a breakout, and since bulls have the upper hand, as seen by the green engulfing candlestick, a break over the resistance level is probable if bulls battle.
Moreover, the price action’s march towards the upper band increases the likelihood that this bull run will endure.
Furthermore, the bullish dominance is supported by the movement of the aroon up and down. As the aroon up crosses above the aroon down, a positive crossing, the JASMY market’s rising trend is expected to continue. This idea is supported by readings of 92.86% and 7.14% on the JASMY 4-hour price chart.
This bullish outlook is reinforced by the Bull Bear Power (BBP) trending in the positive area. However, with a reading of 0.000461, the BBP is going south, prompting traders to be concerned that the bullish trend is fading.
The bullish supremacy is being tested when the stochastic RSI (now at 59.68) falls below its simple moving average line. This shift raises a red flag, warning traders to keep an eye out for potential bearish developments in the near future.
The Chaikin Money Flow (CMF) is showing a sideways movement at 0.20, adding weight to the bearish perspective. The trend in the CMF, however, counteracts this negative outlook, suggesting that the bulls’ domain may persist even if the bulls disregard the bearish viewpoints.
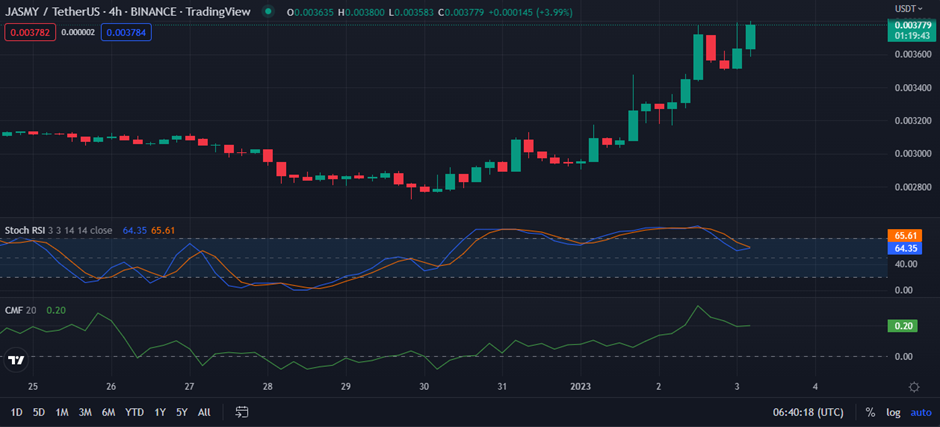
If the bulls in JASMY can maintain control of the resistance level, the bullish trend might continue even if there are warning indicators that bull vigor is ebbing.
Disclaimer: The views and opinions, as well as all the information shared in this price analysis, are published in good faith. Readers must do their own research and due diligence. Any action taken by the reader is strictly at their own risk, Coin Edition and its affiliates will not be held liable for any direct or indirect damage or loss.
Disclaimer: The information presented in this article is for informational and educational purposes only. The article does not constitute financial advice or advice of any kind. Coin Edition is not responsible for any losses incurred as a result of the utilization of content, products, or services mentioned. Readers are advised to exercise caution before taking any action related to the company.


